Selected works
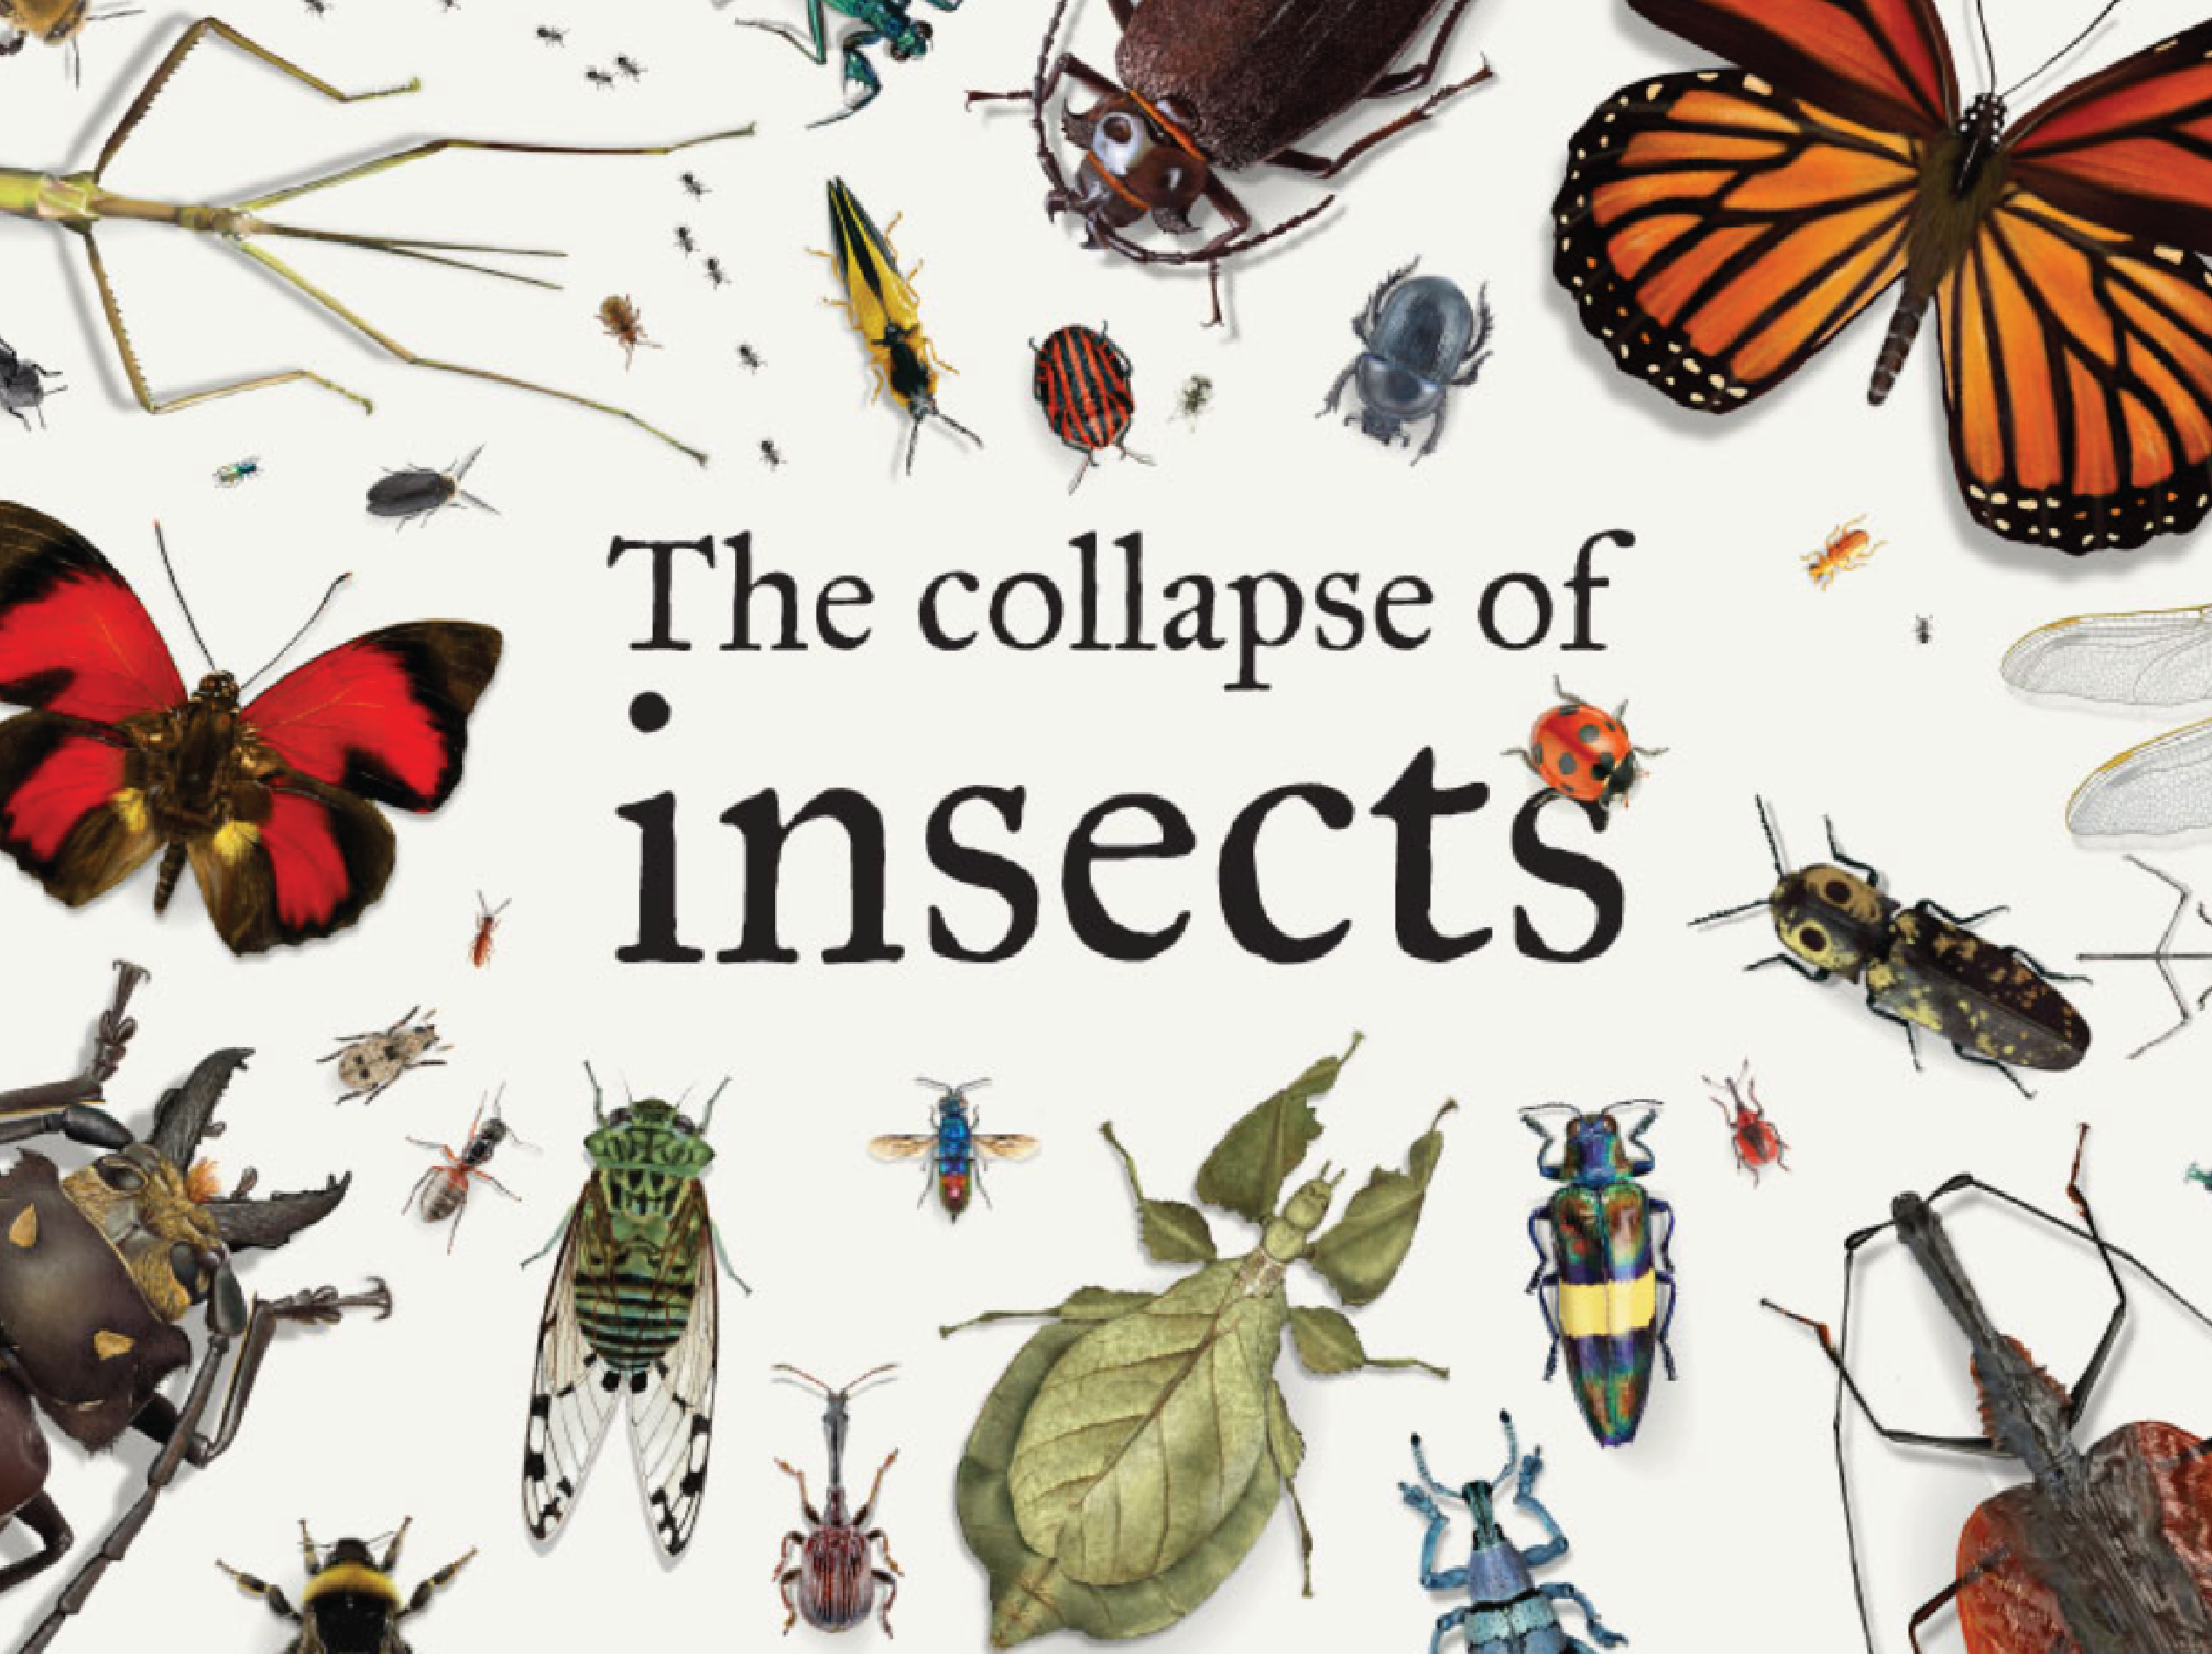
The Collapse of Insects
Data journalism
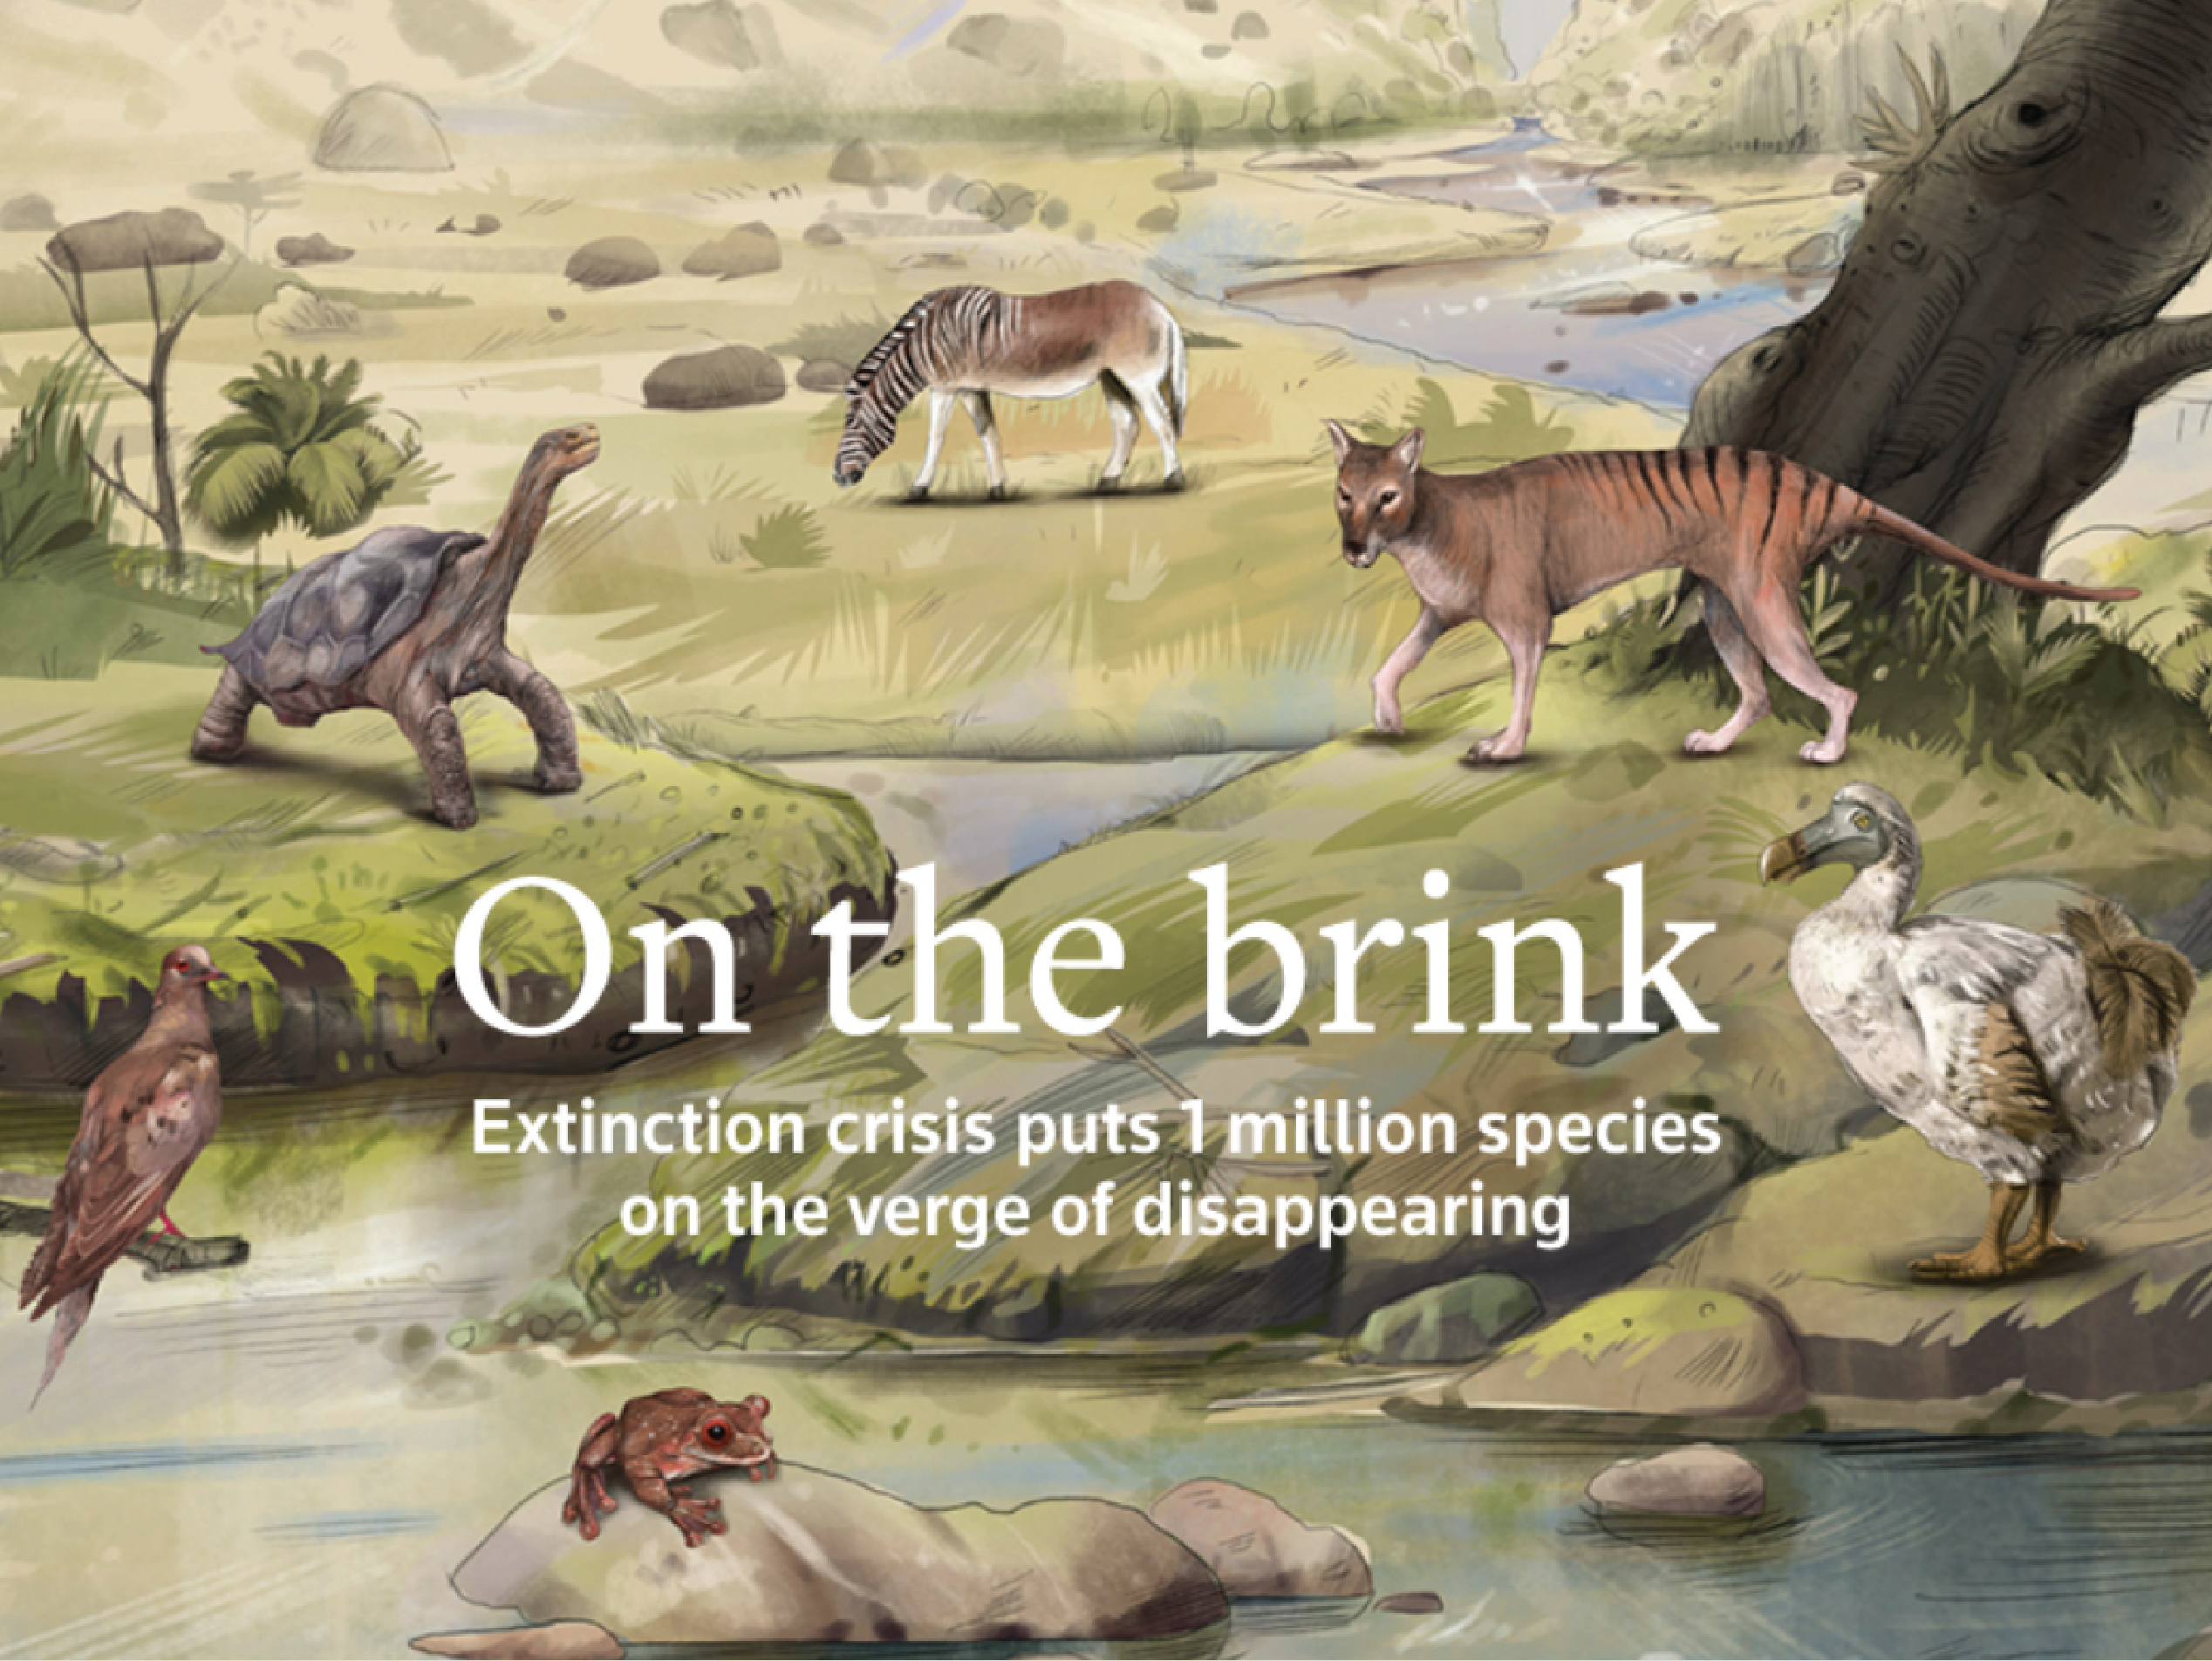
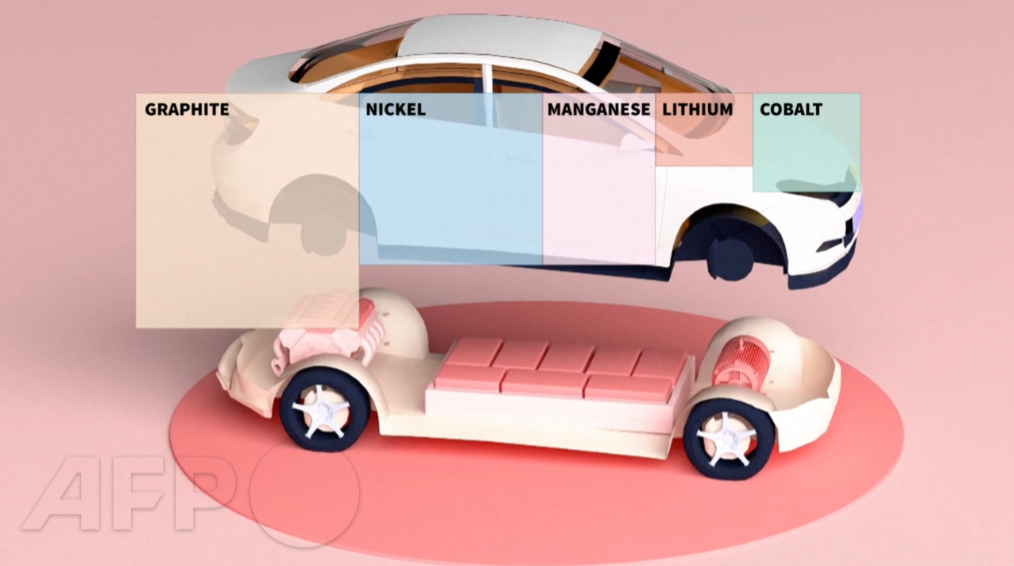
On the brink
Data journalism
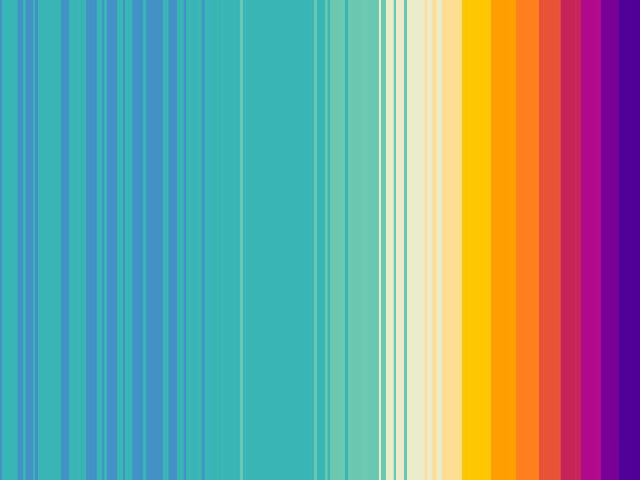
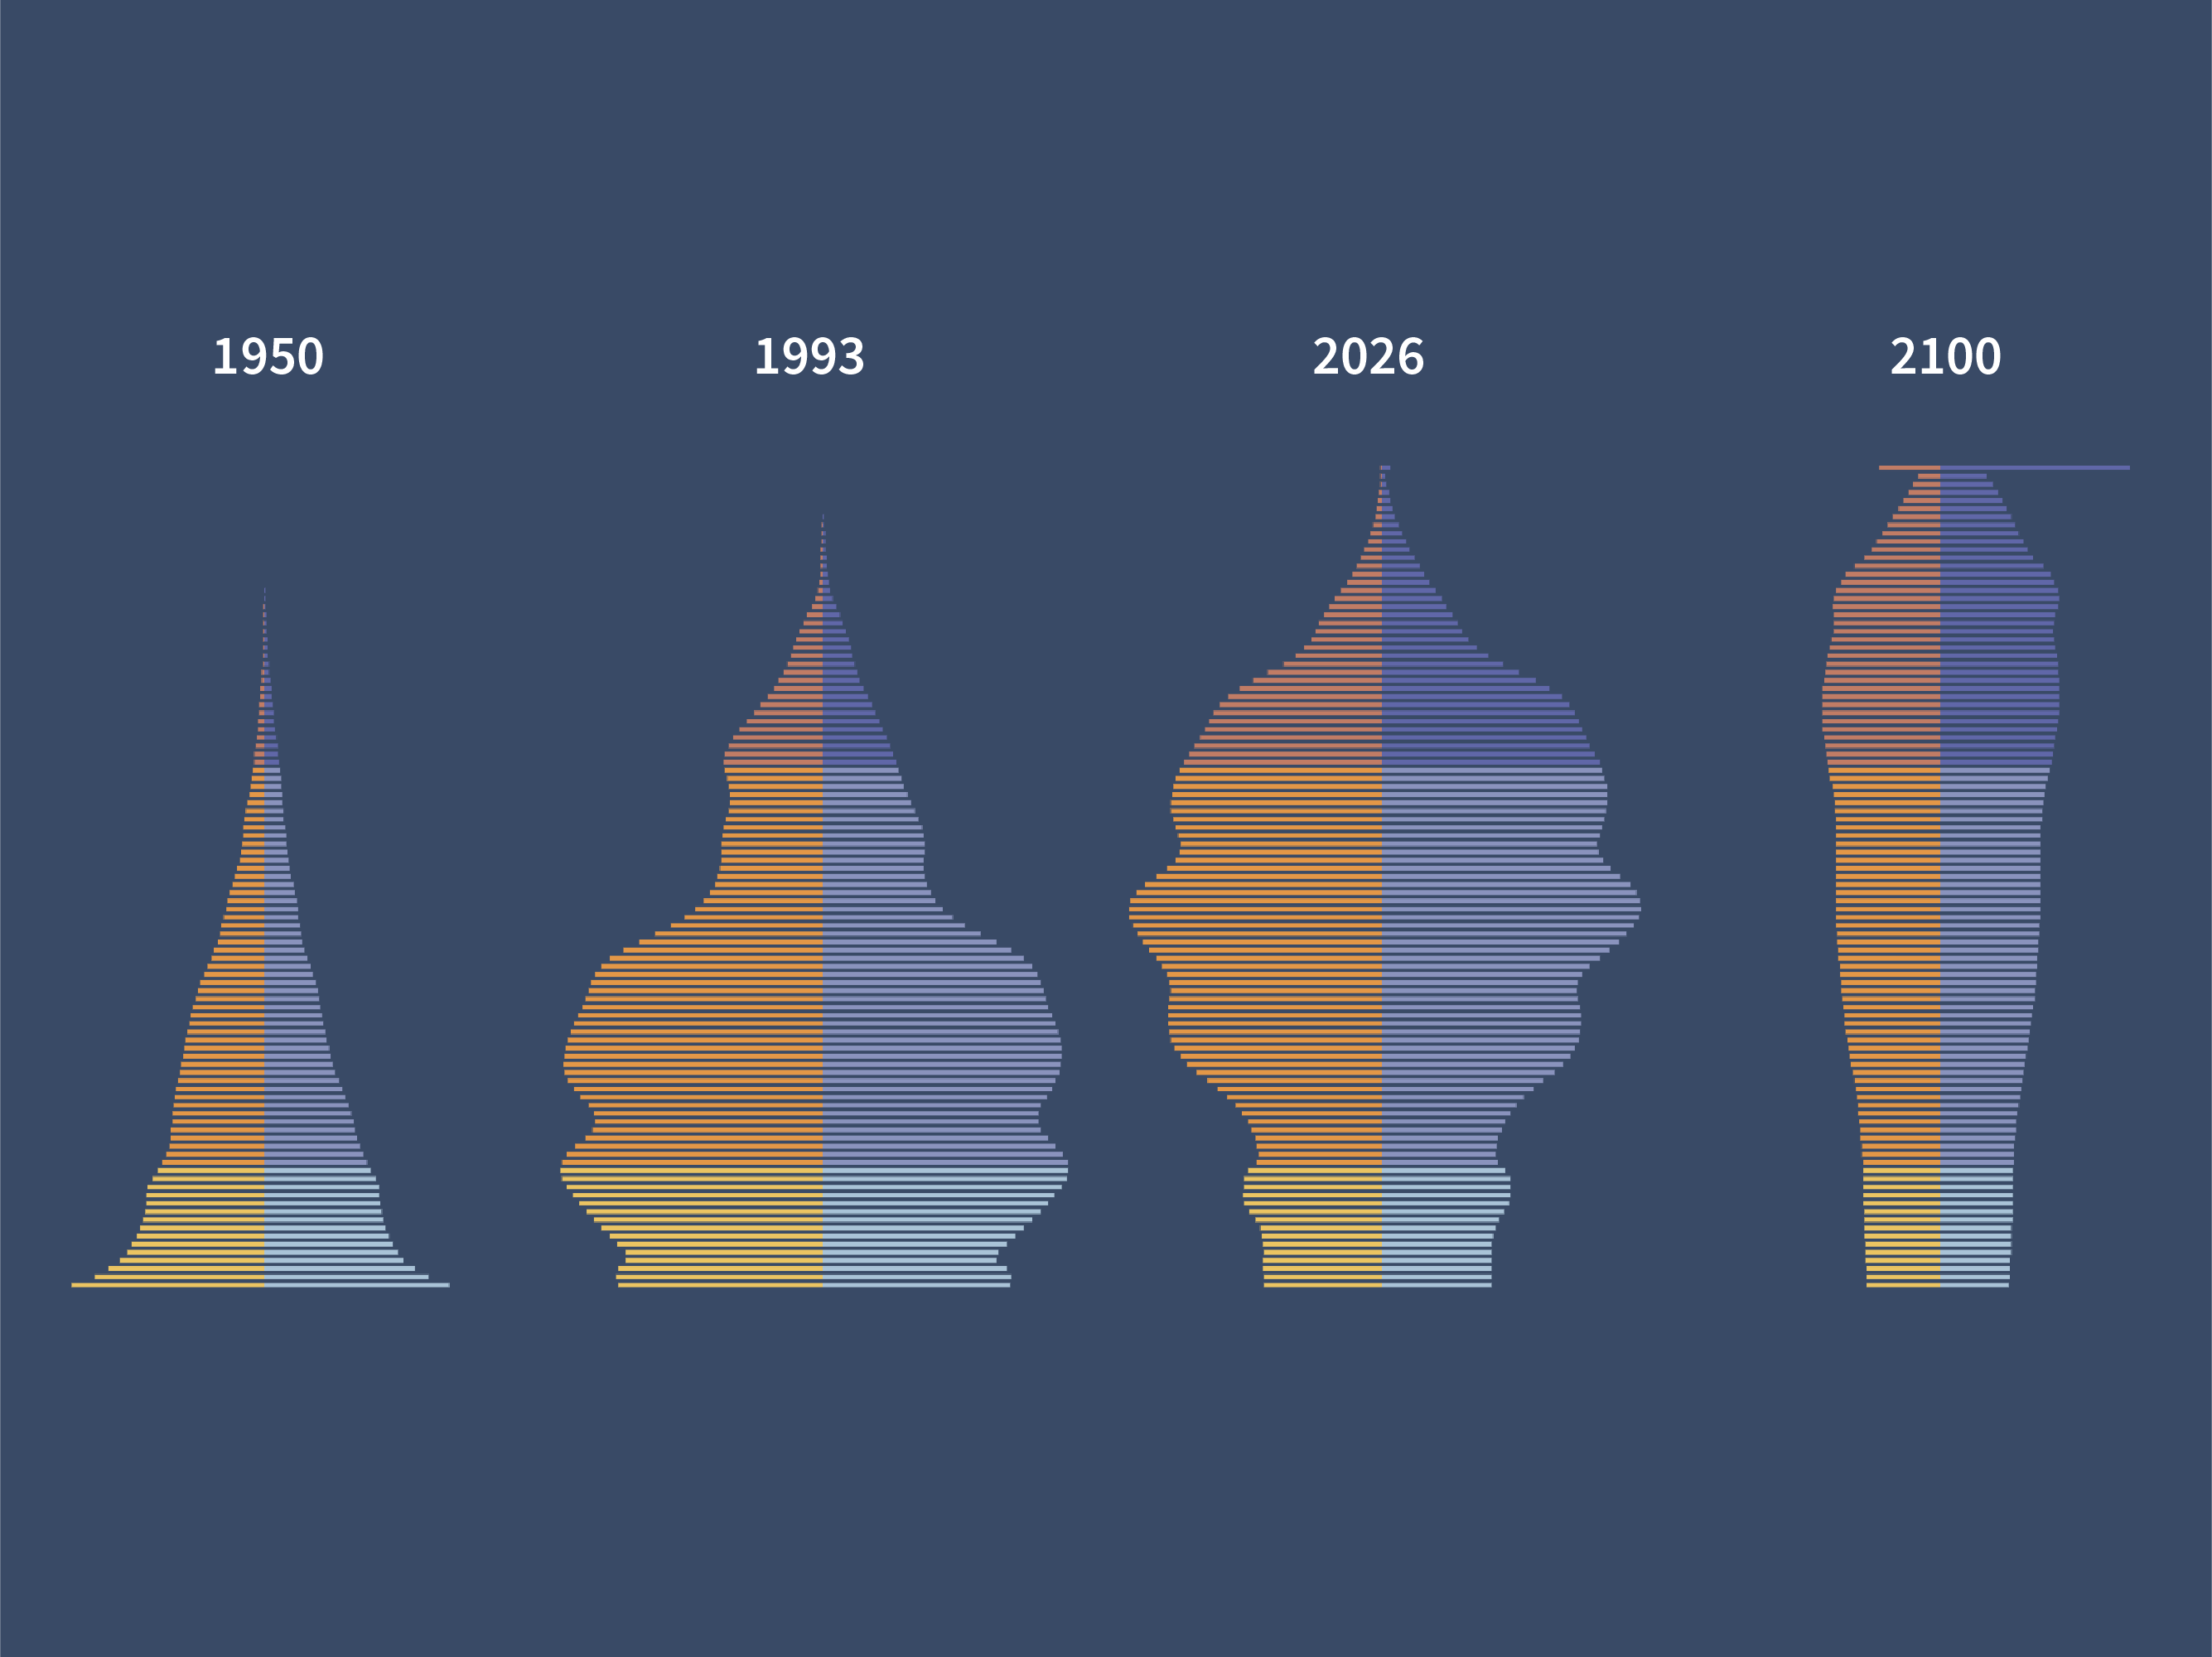
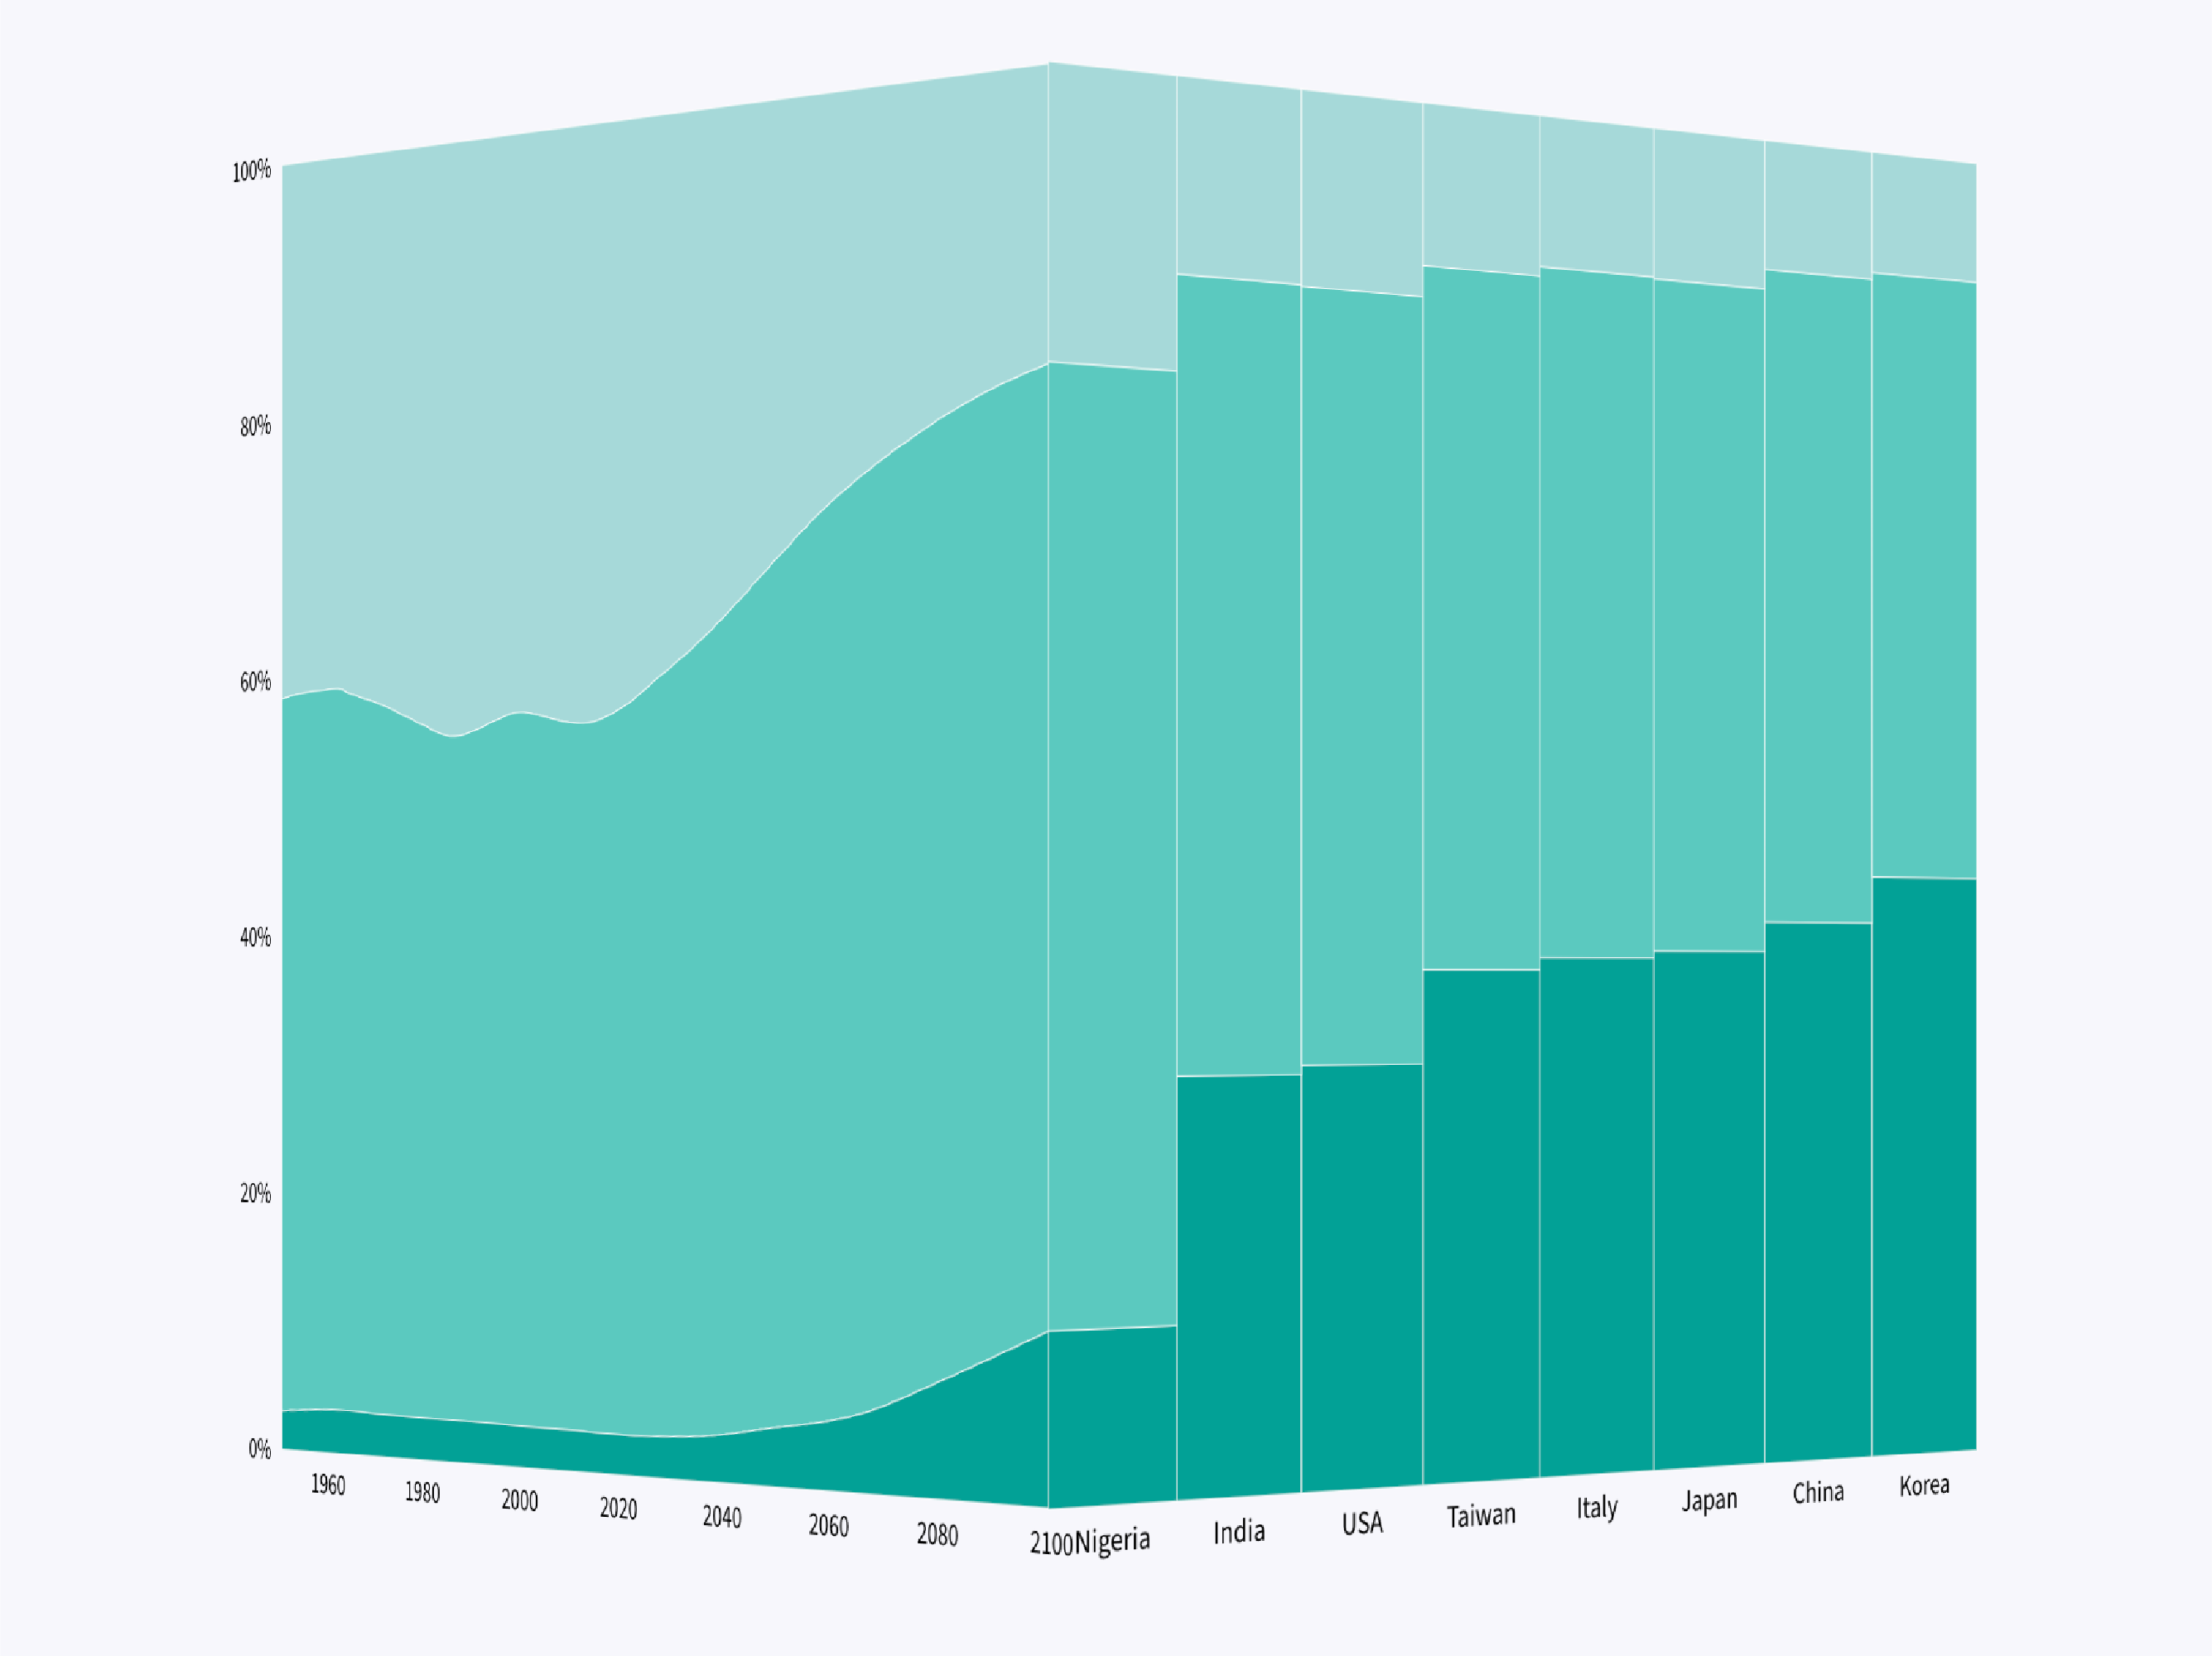
A lifetime of change
Data journalism, User-driven story
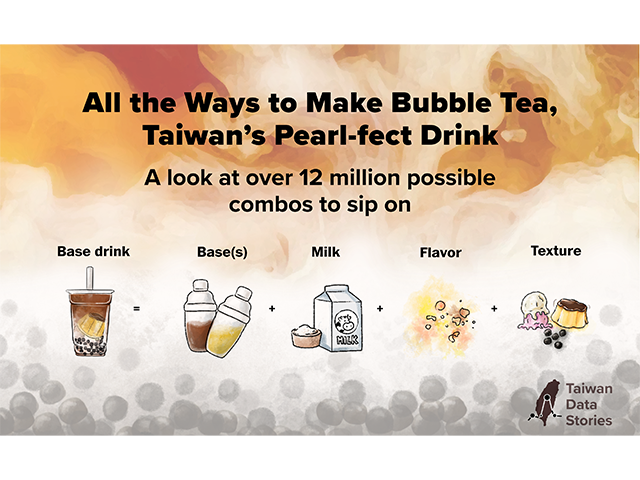
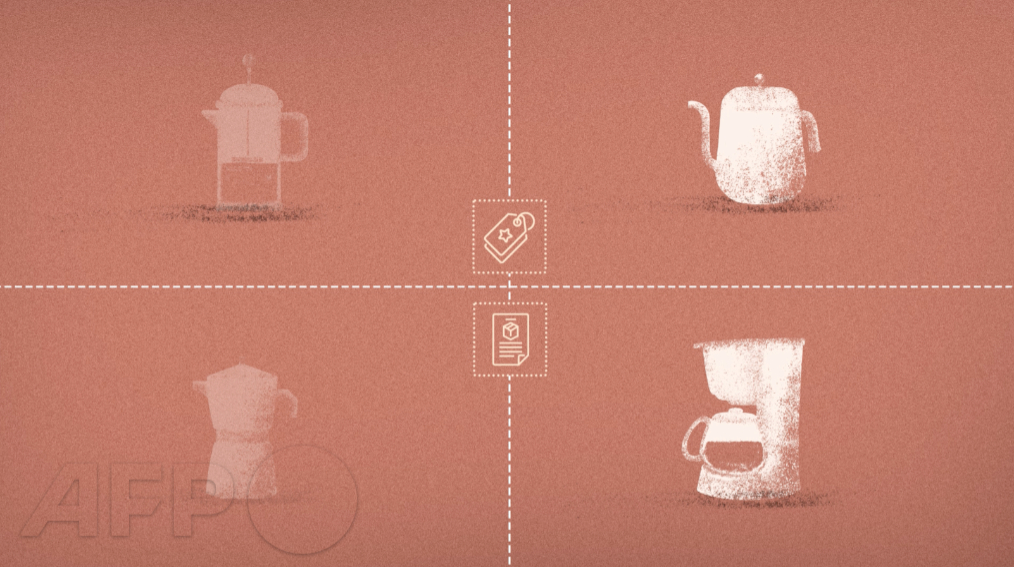
All the ways to make bubble tea
Data storytelling, User-driven story
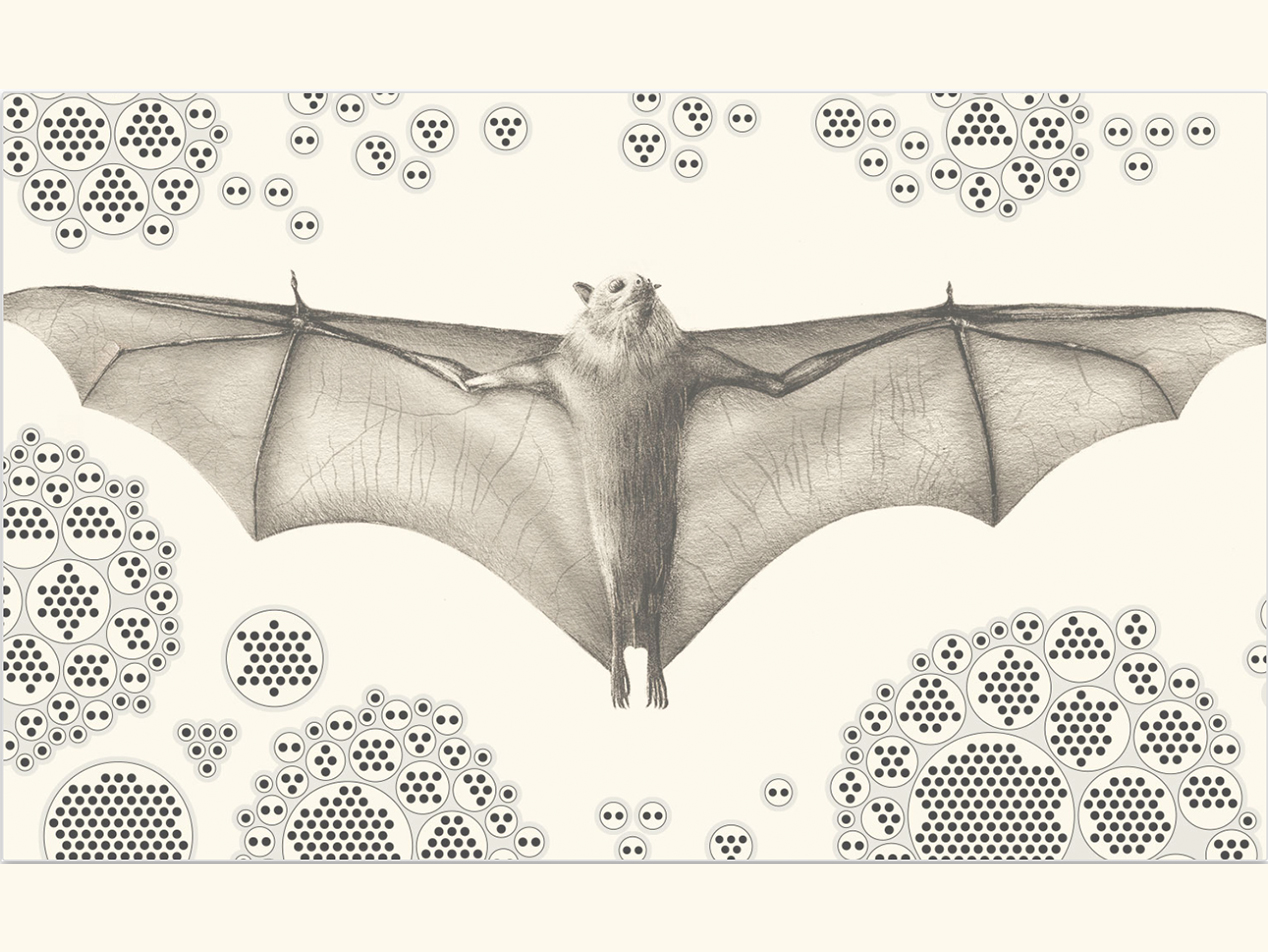
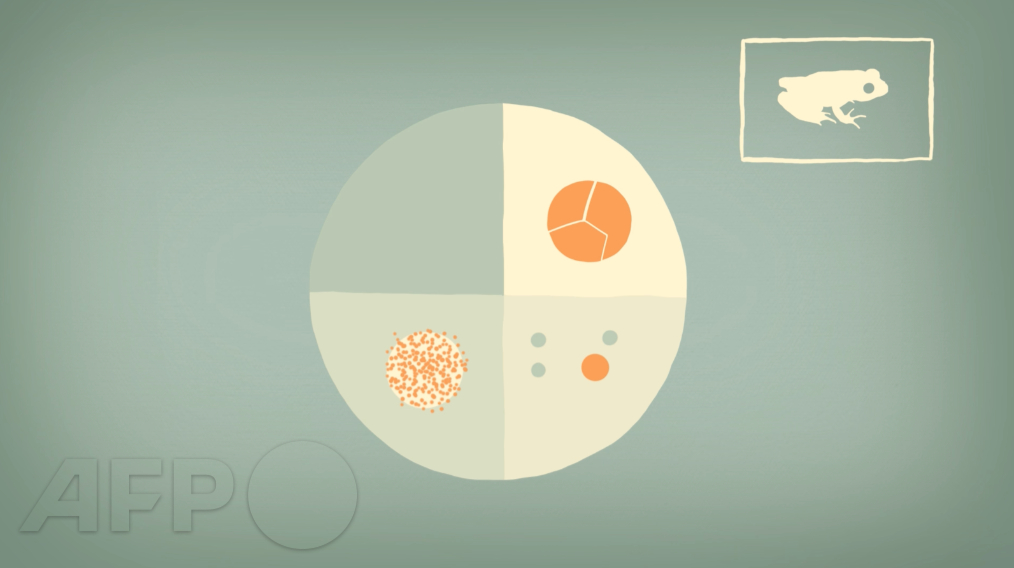
Bats and the origin of outbreaks
Data journalism
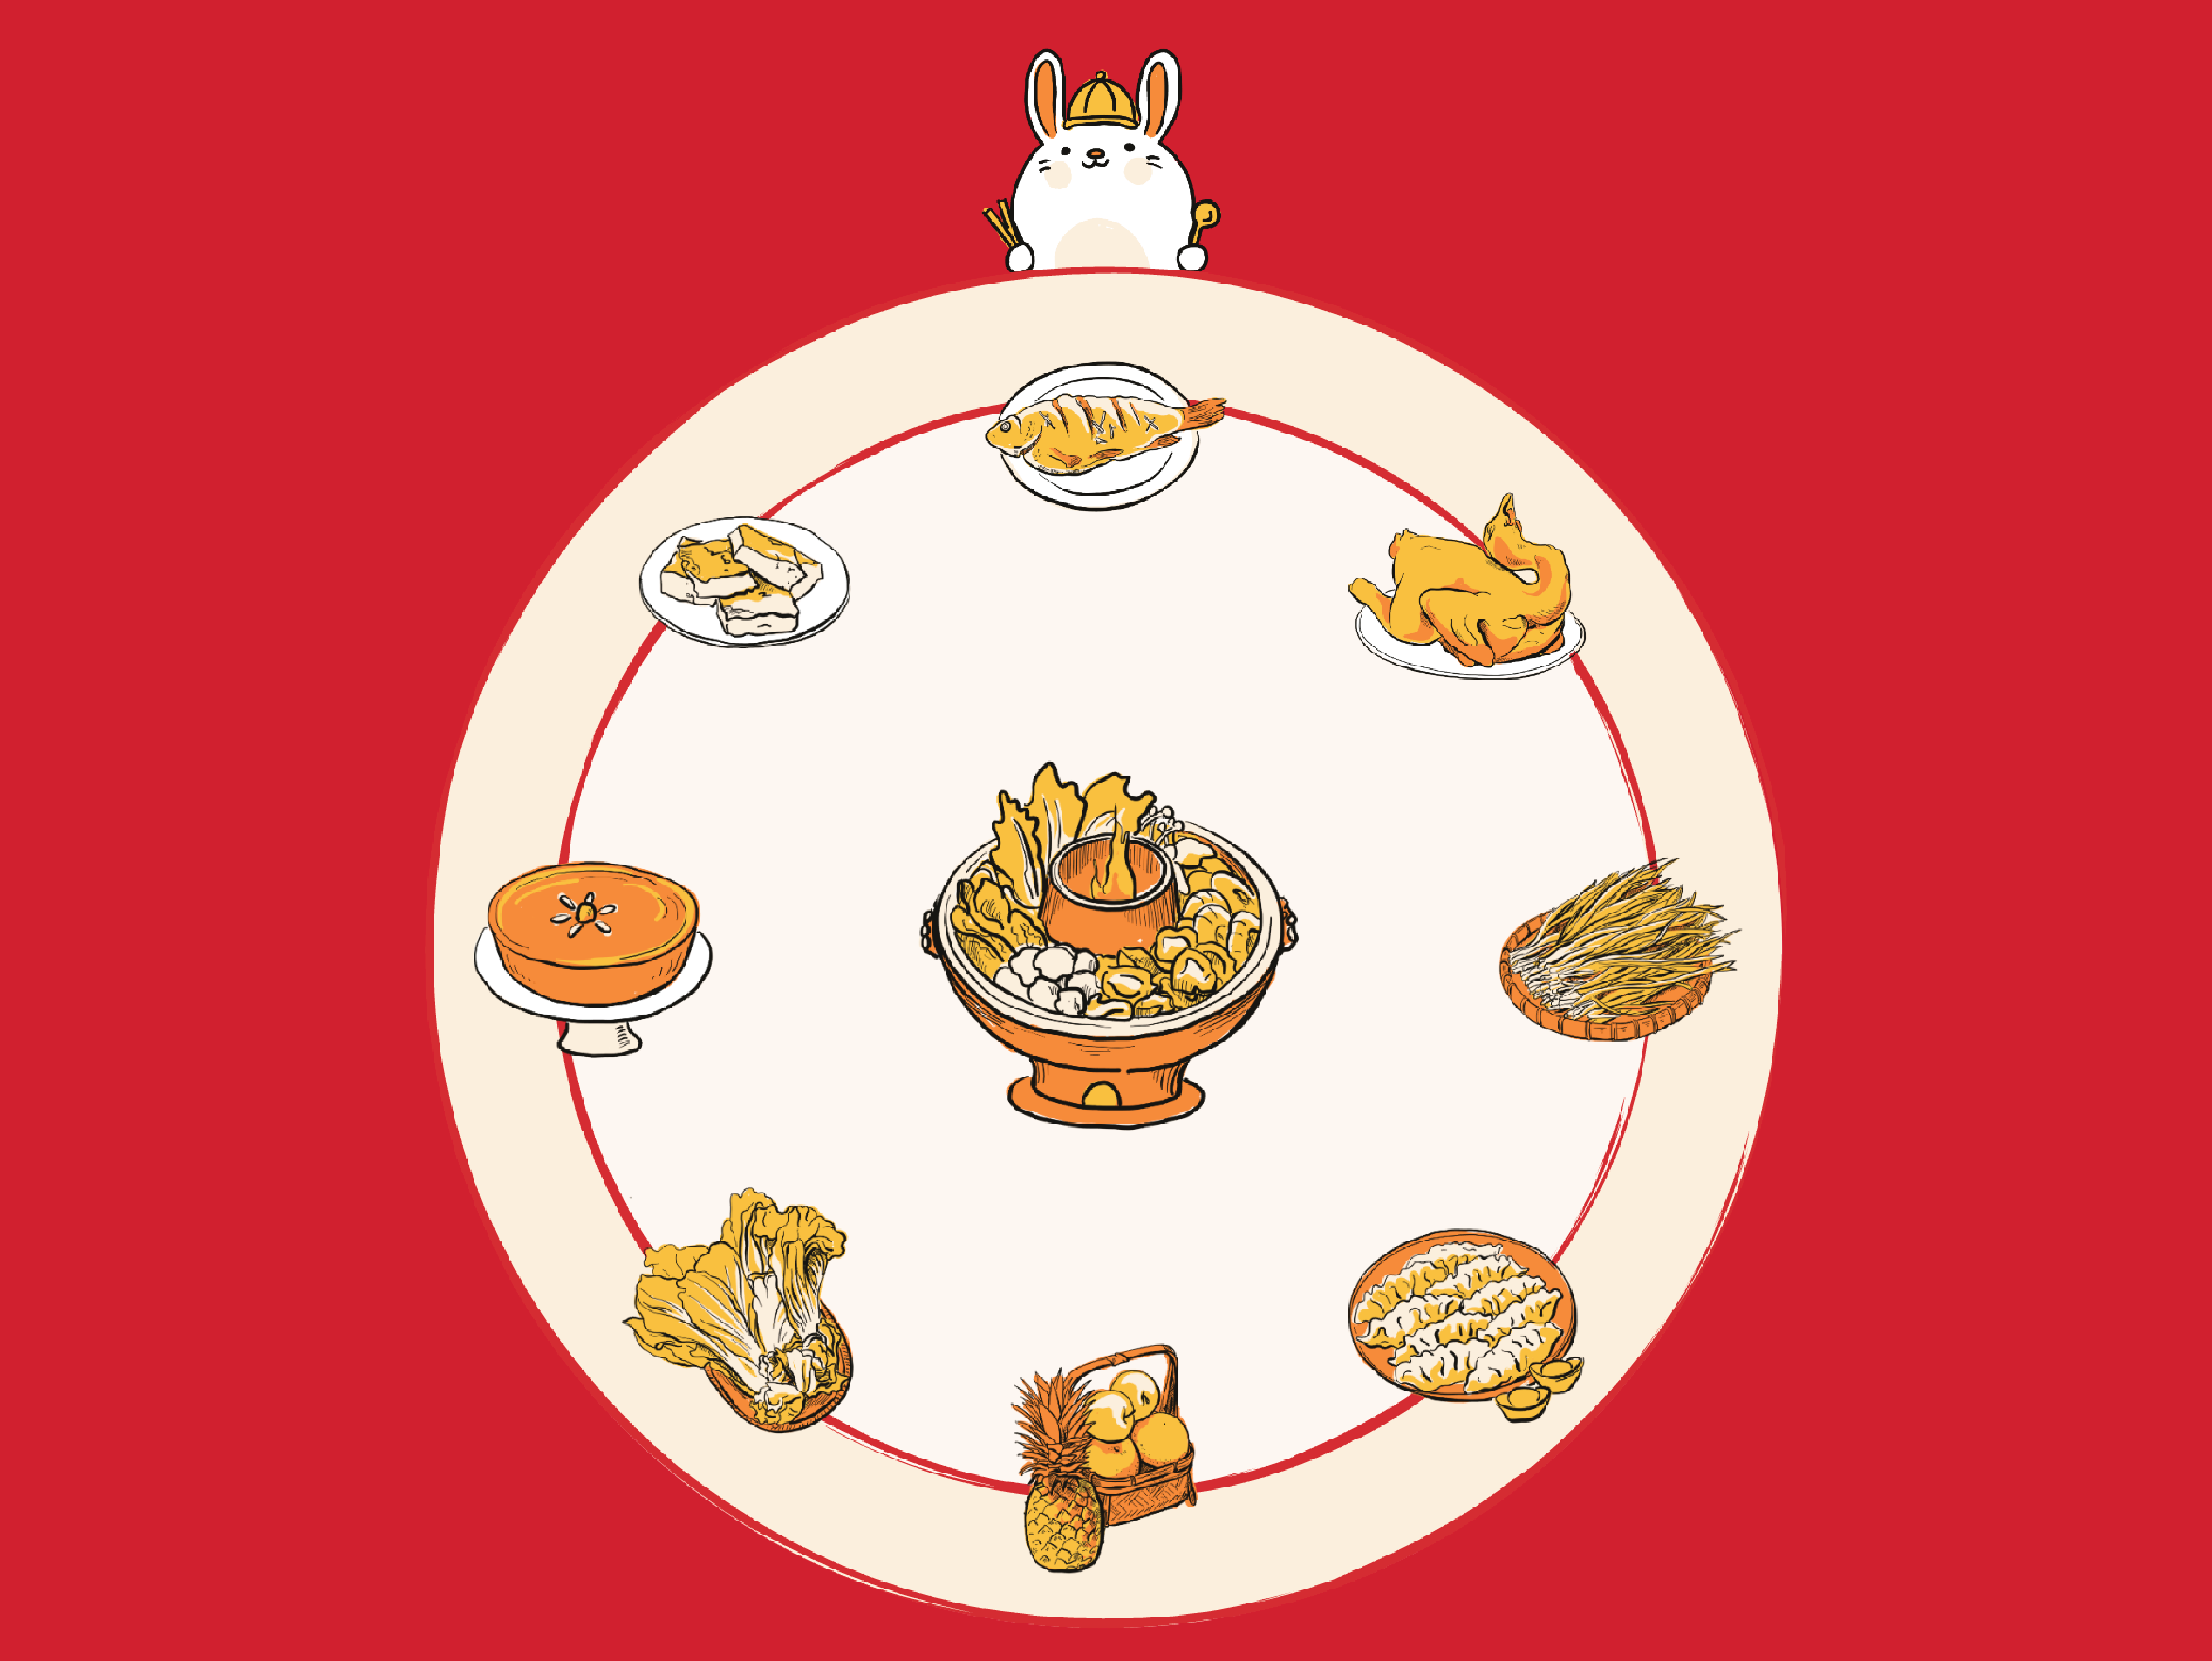
Taiwan's Lunar New Year
Data storytelling
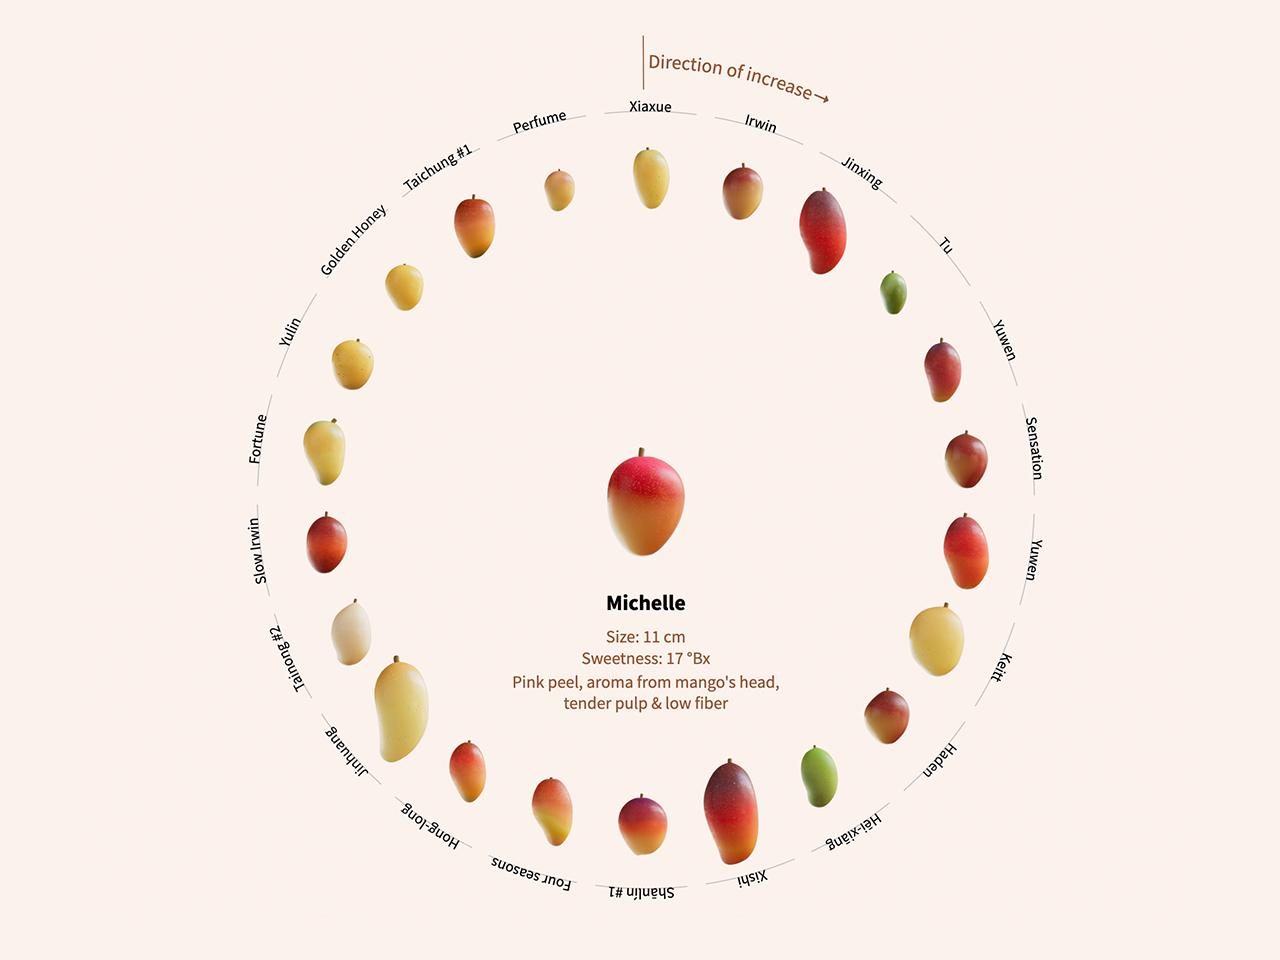
Mangoes in Taiwan
Data storytelling
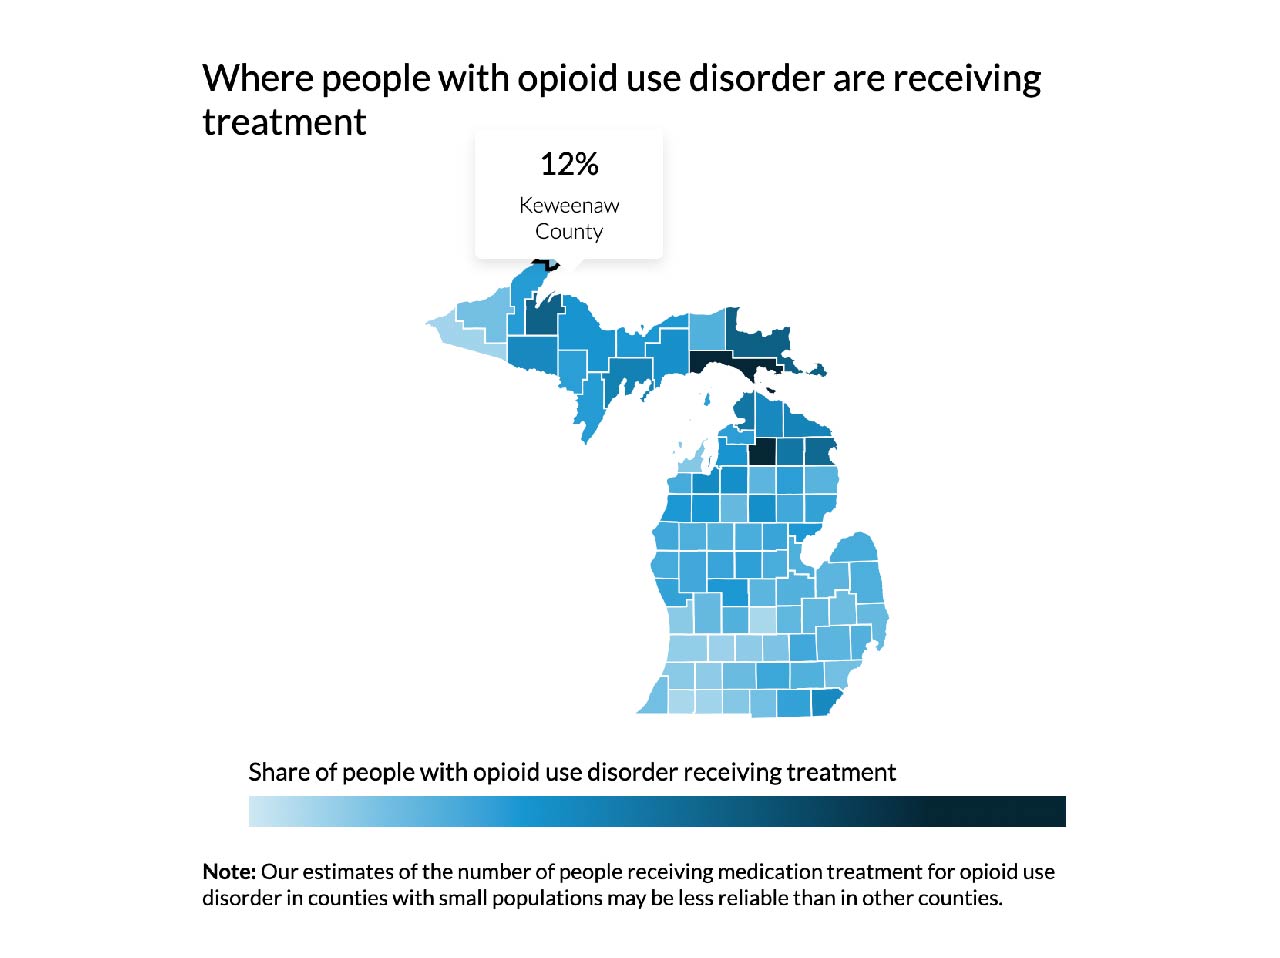
Opioid Use Disorder tool
Exploratory tool, Web development
How to get America vaccinated?
Data journalism
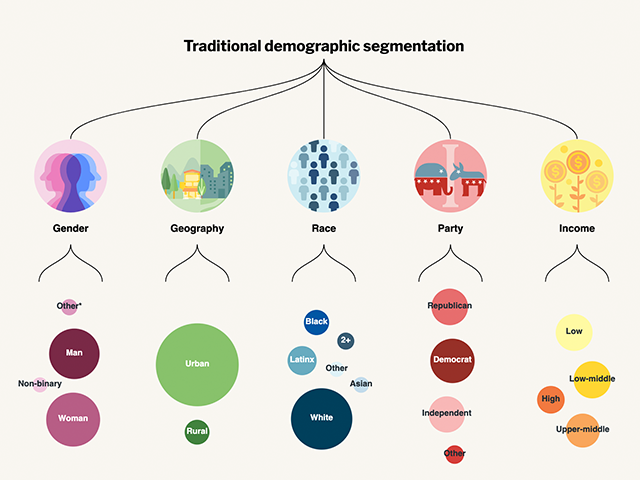
More pets than children
Data journalism
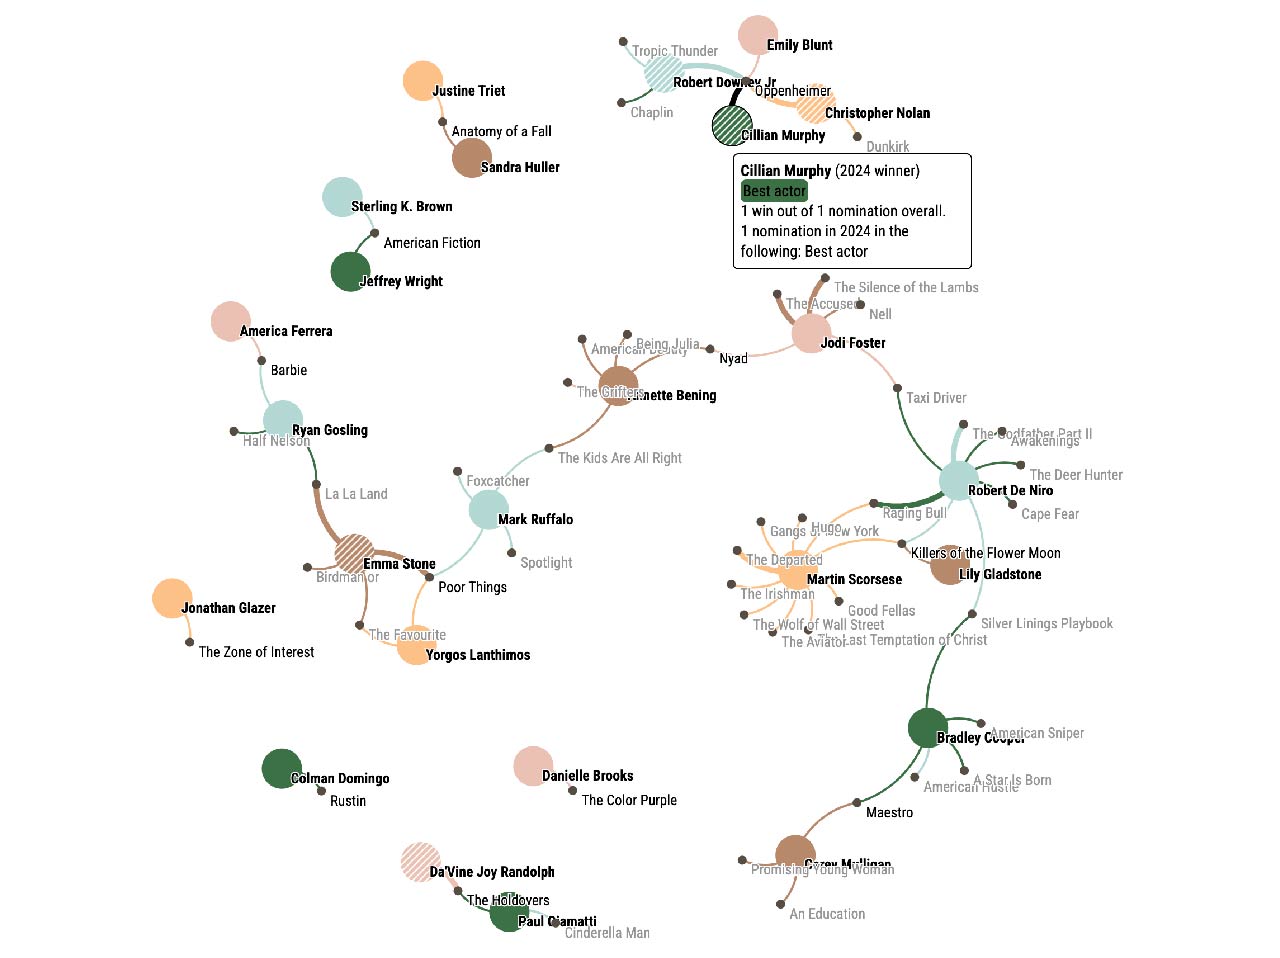
2024 Oscars nominees network
Decided to turn static graphics at work into interactives series...
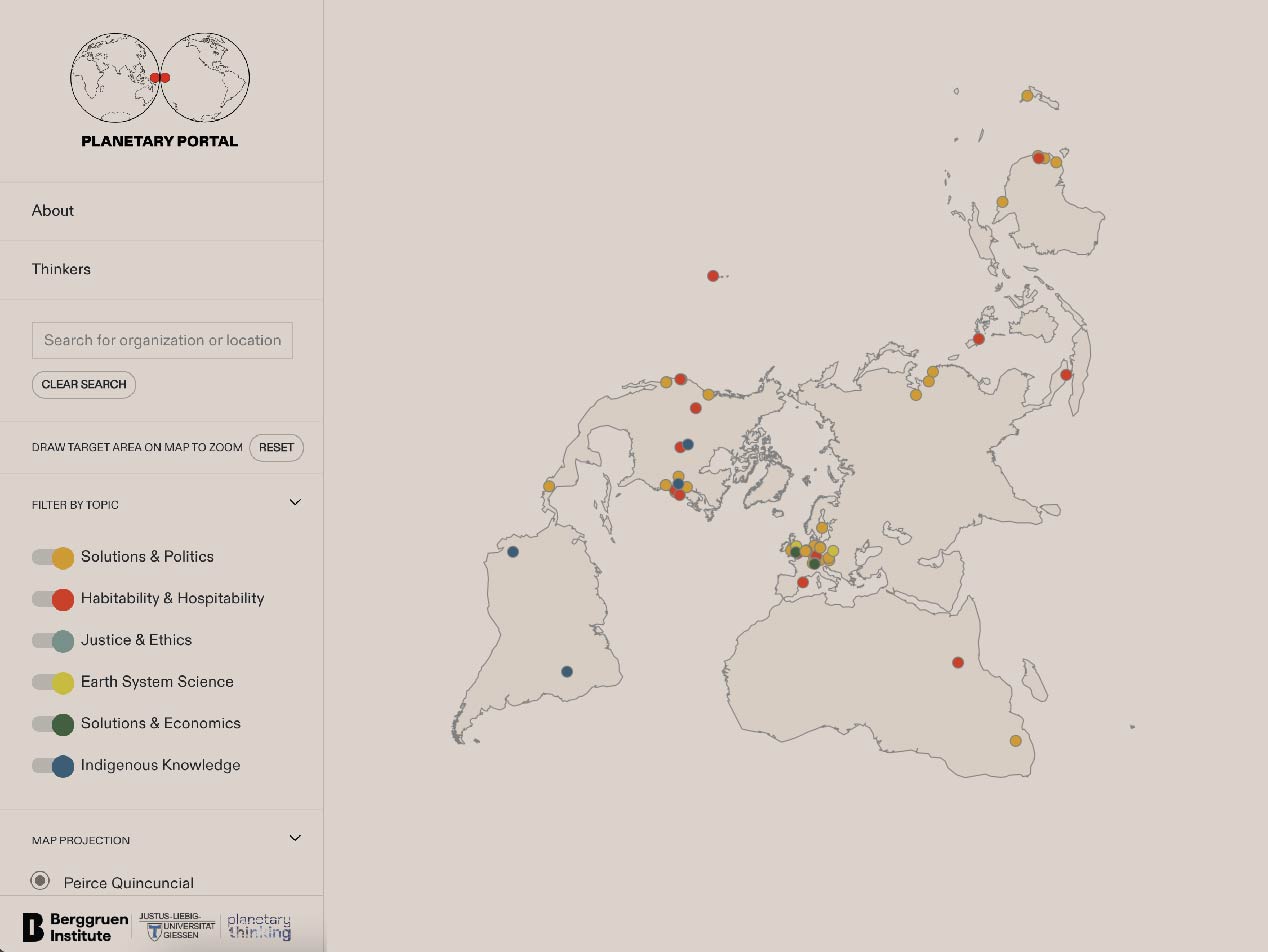
Planetary Portal
Exploratory tool, Web development
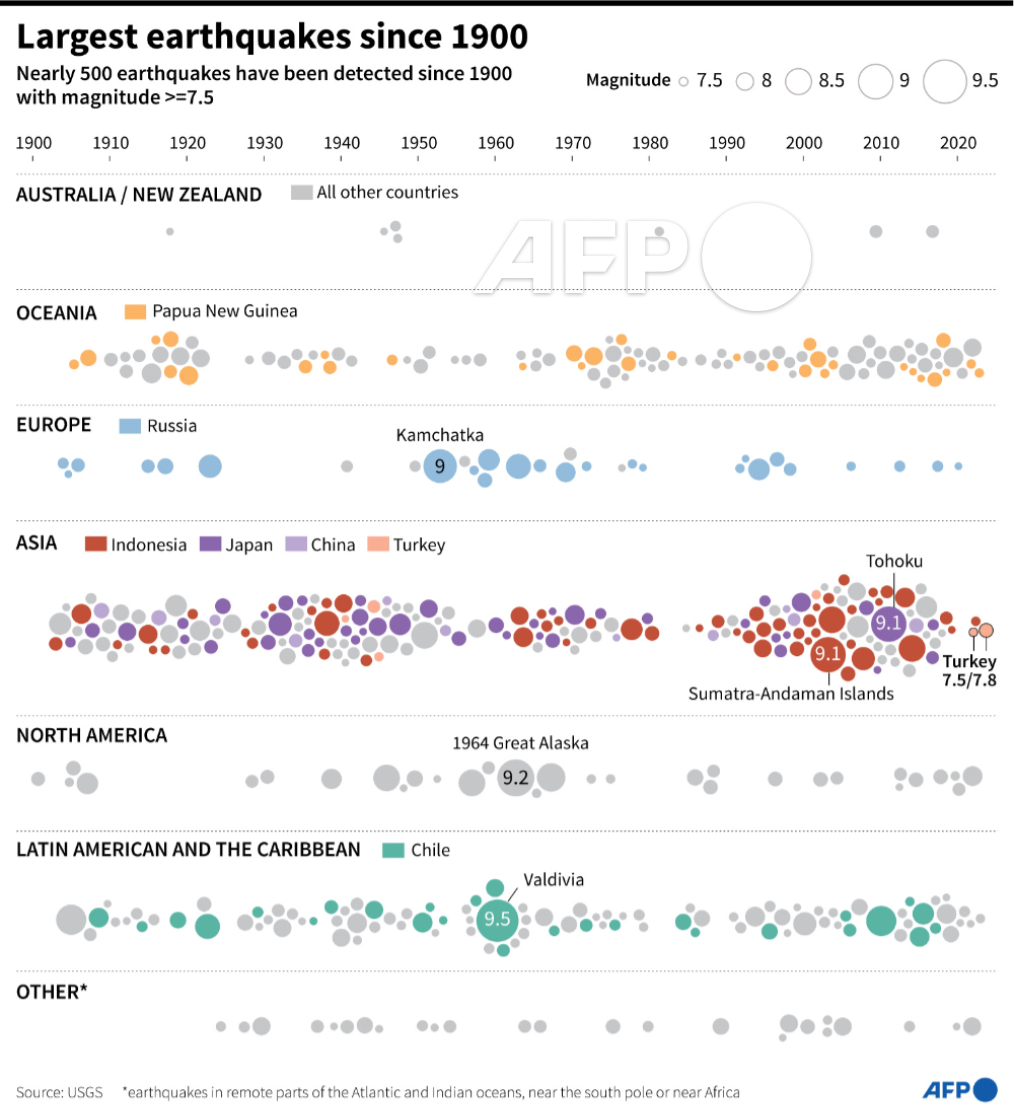
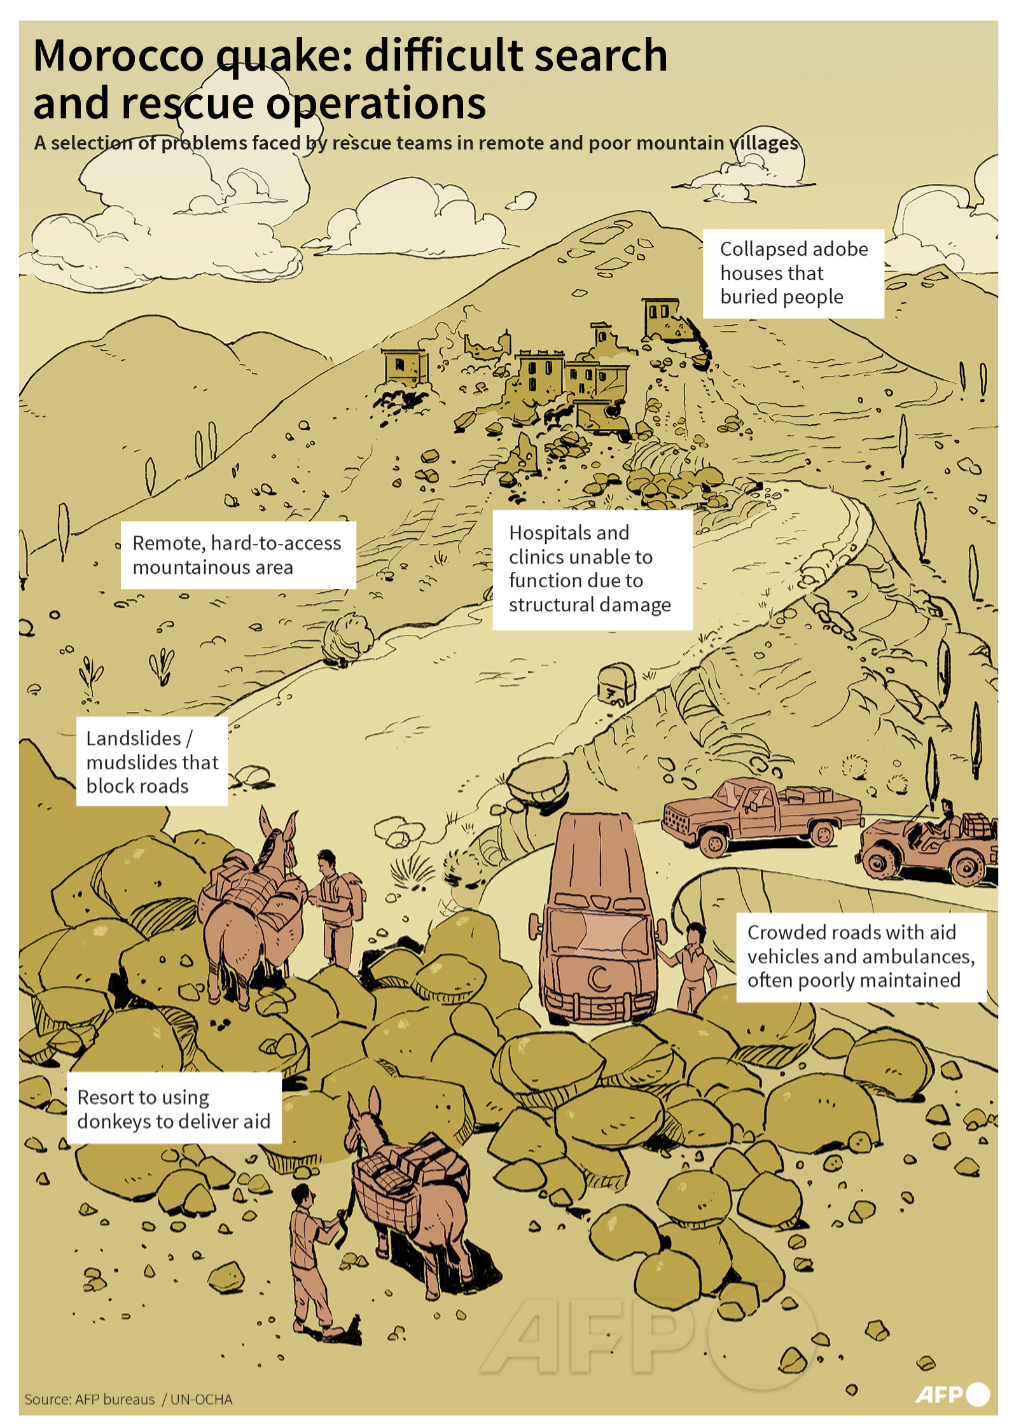
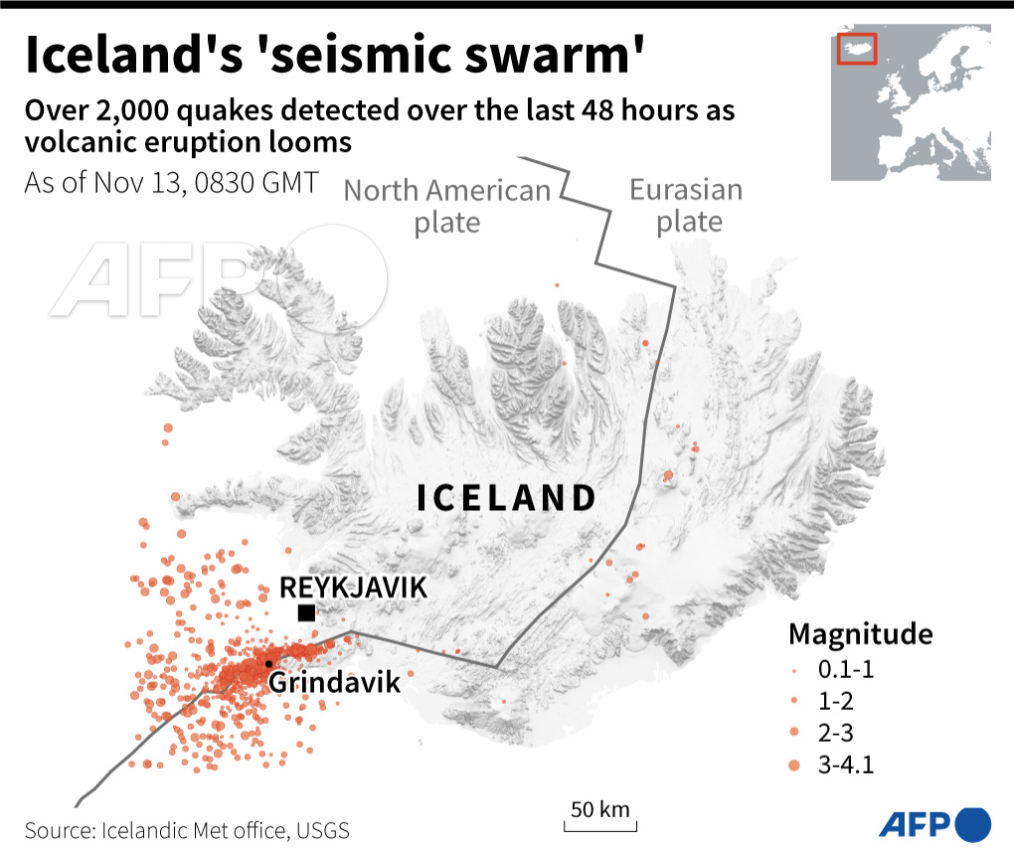
Selected work AFP: earthquakes
Data journalism
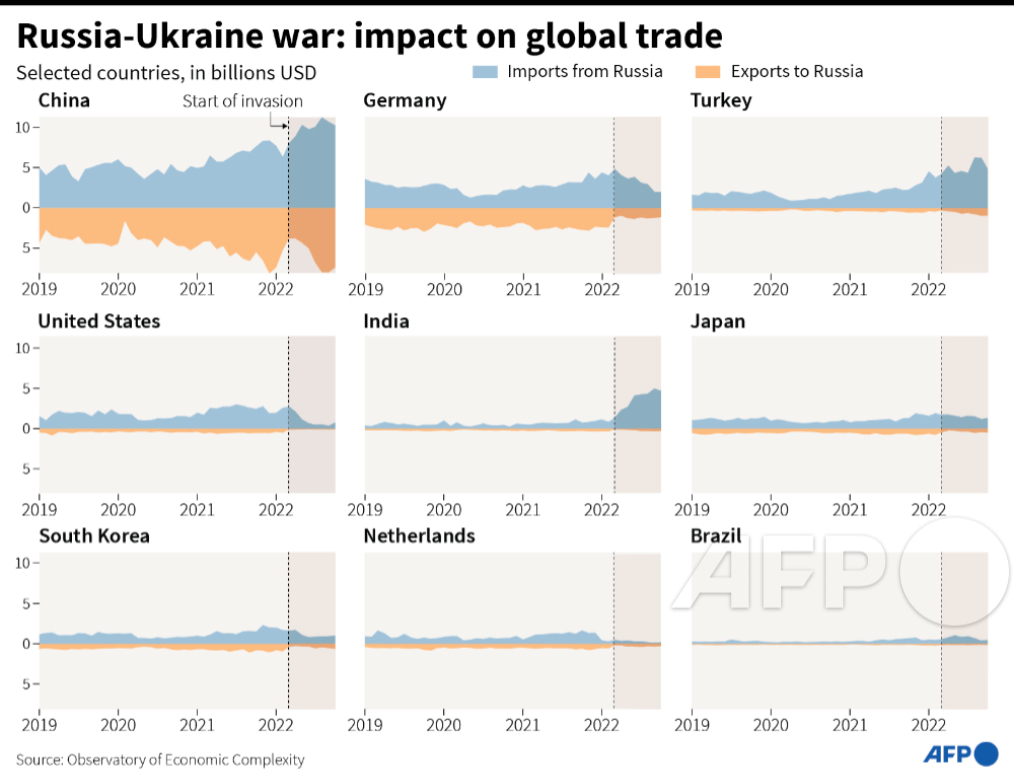
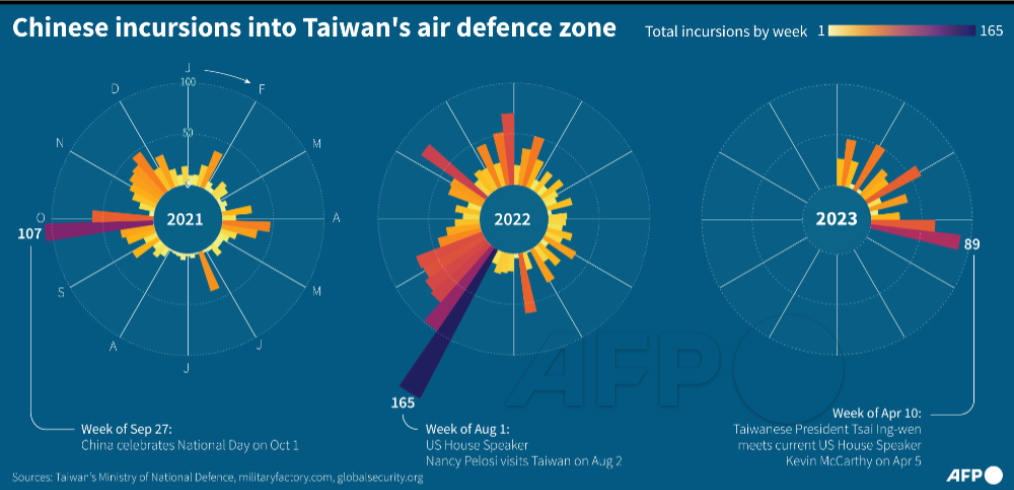
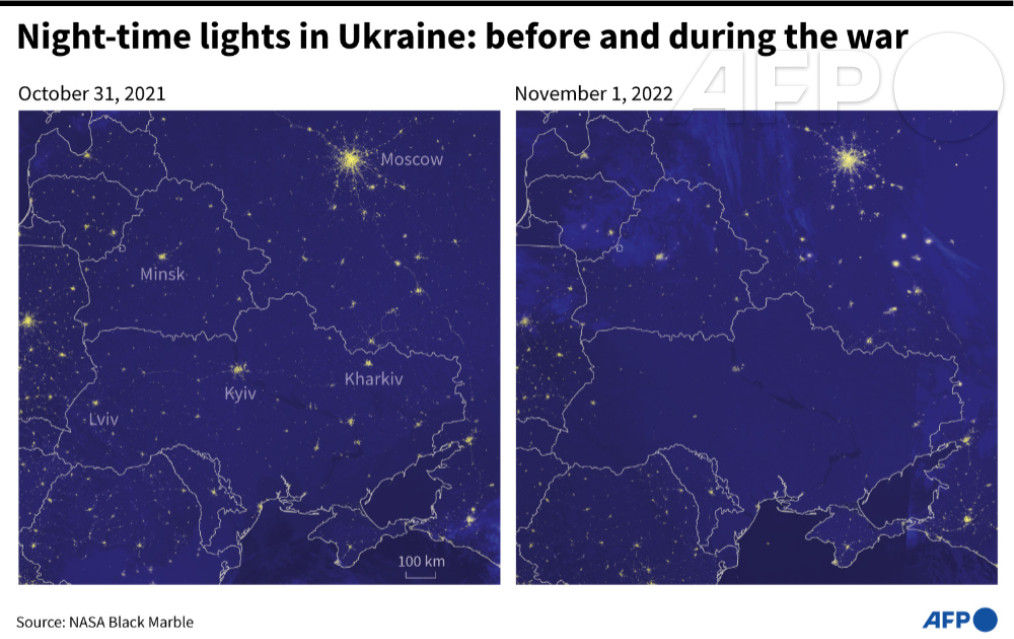
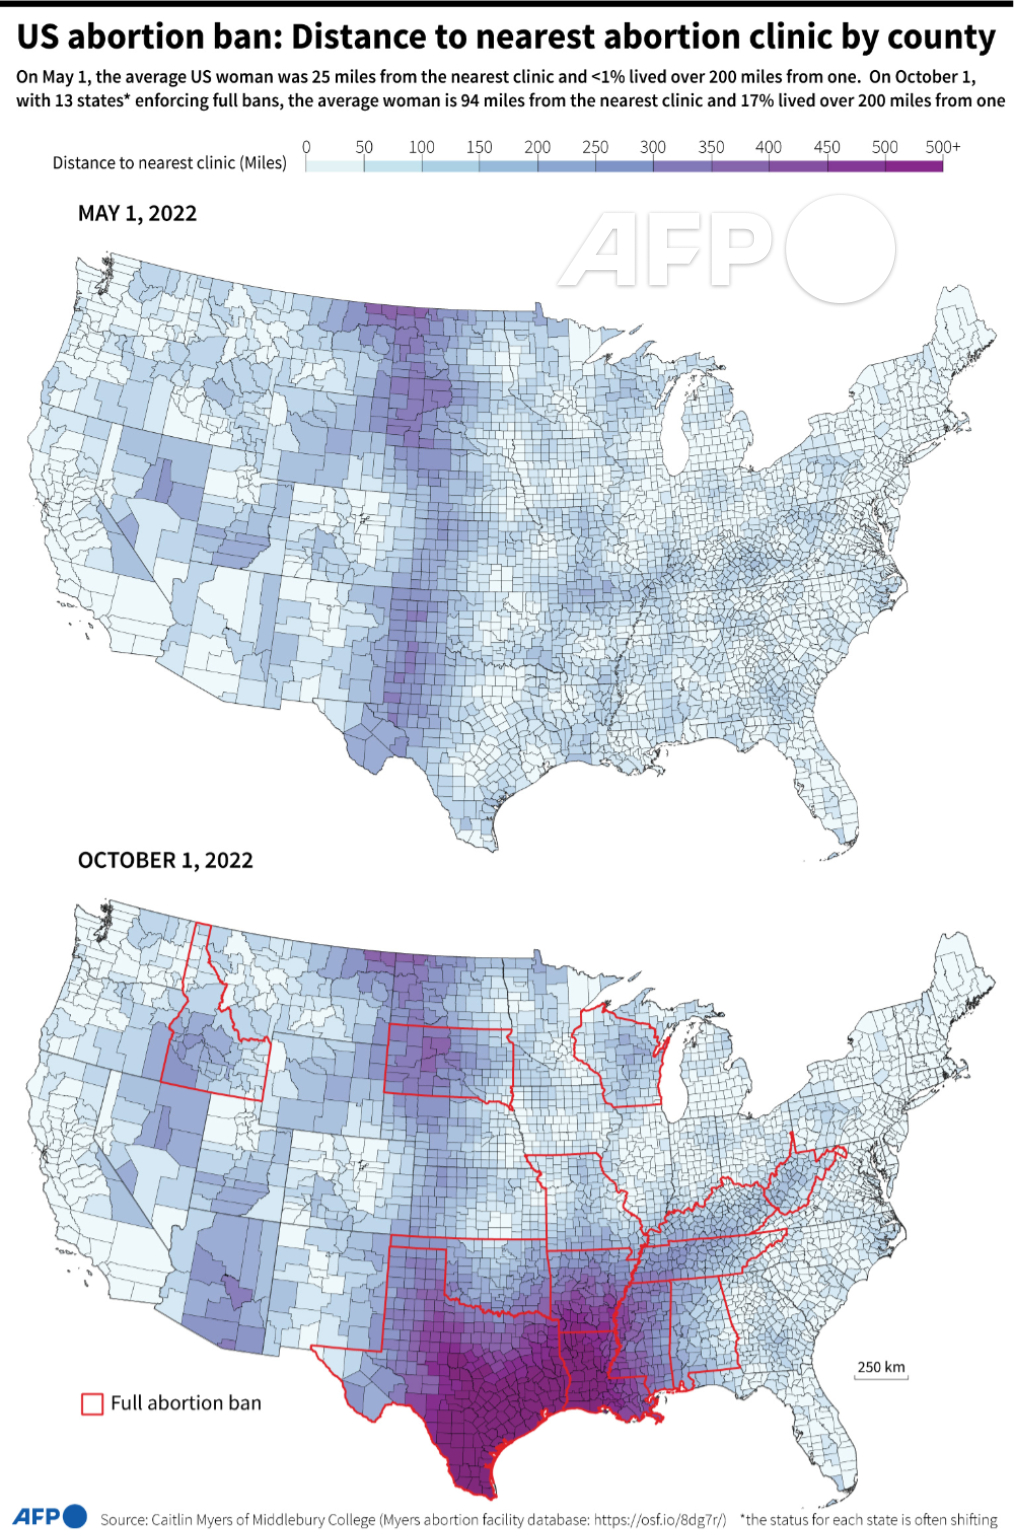
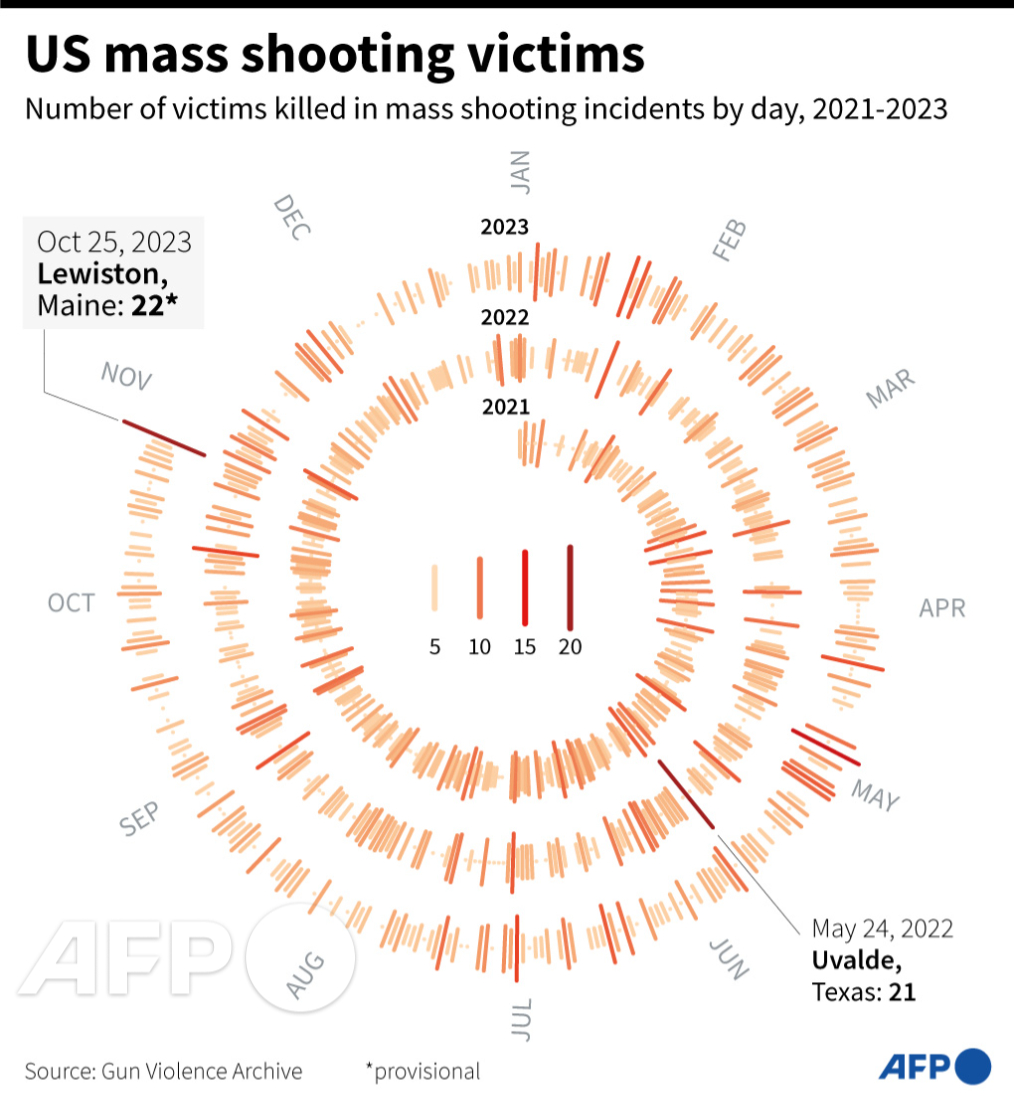
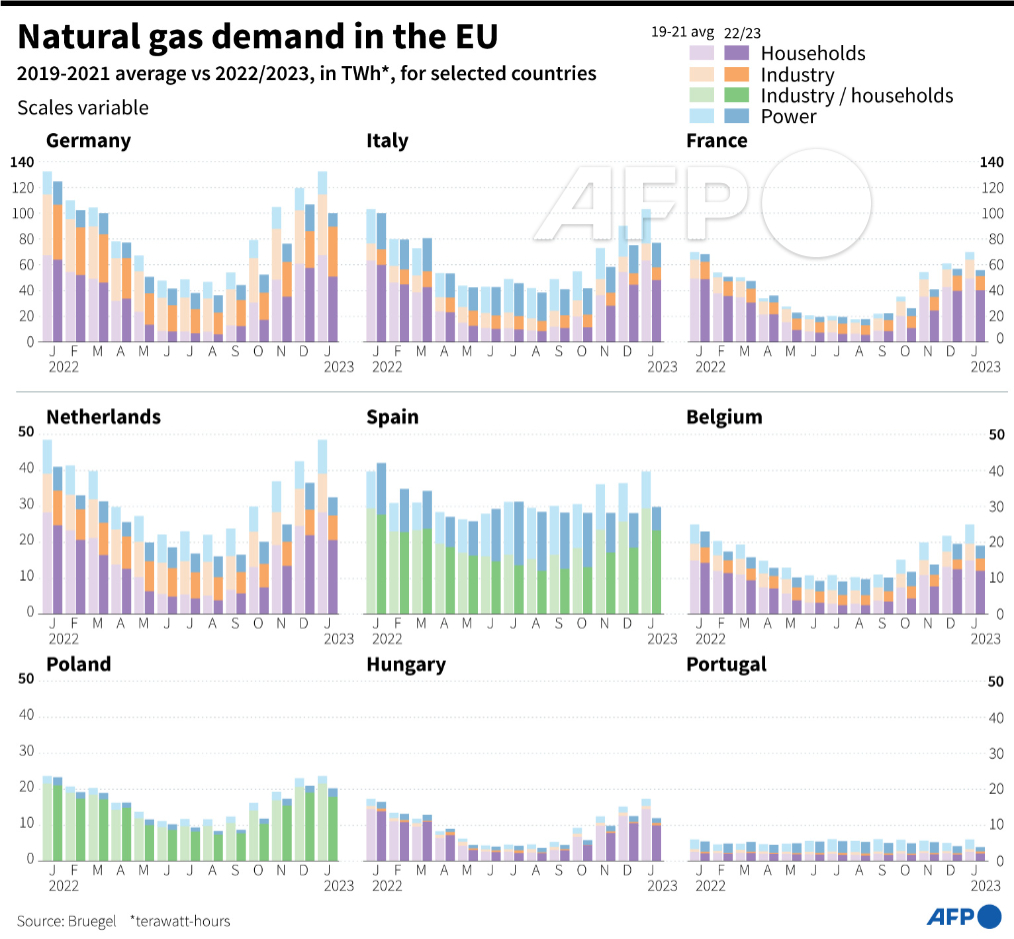
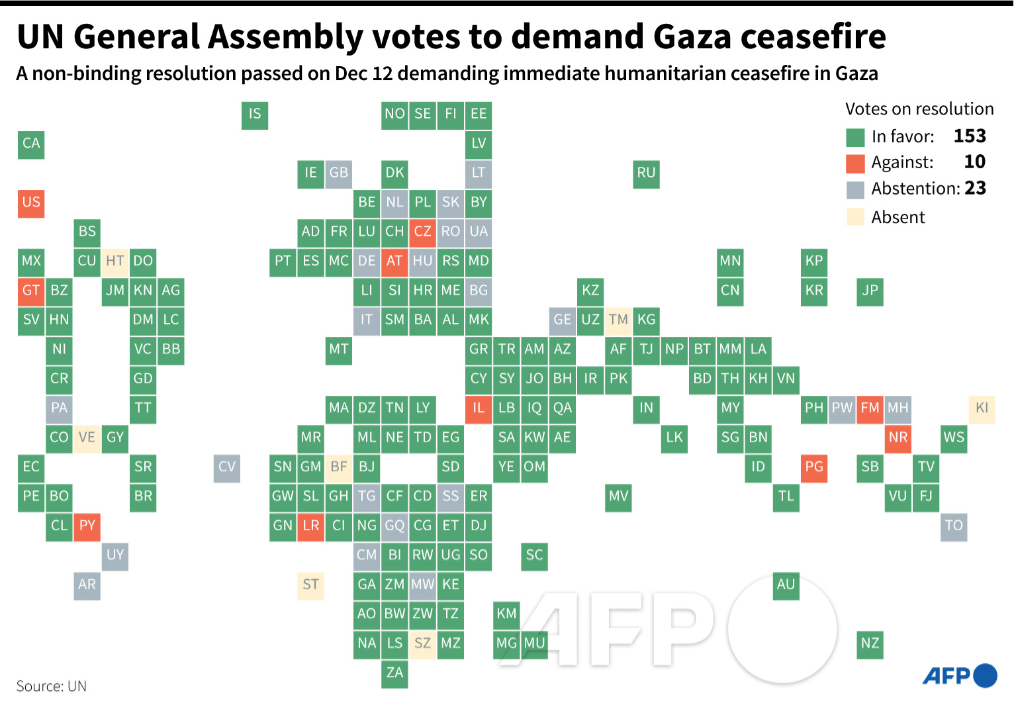
Selected work AFP: current affairs
Data journalism
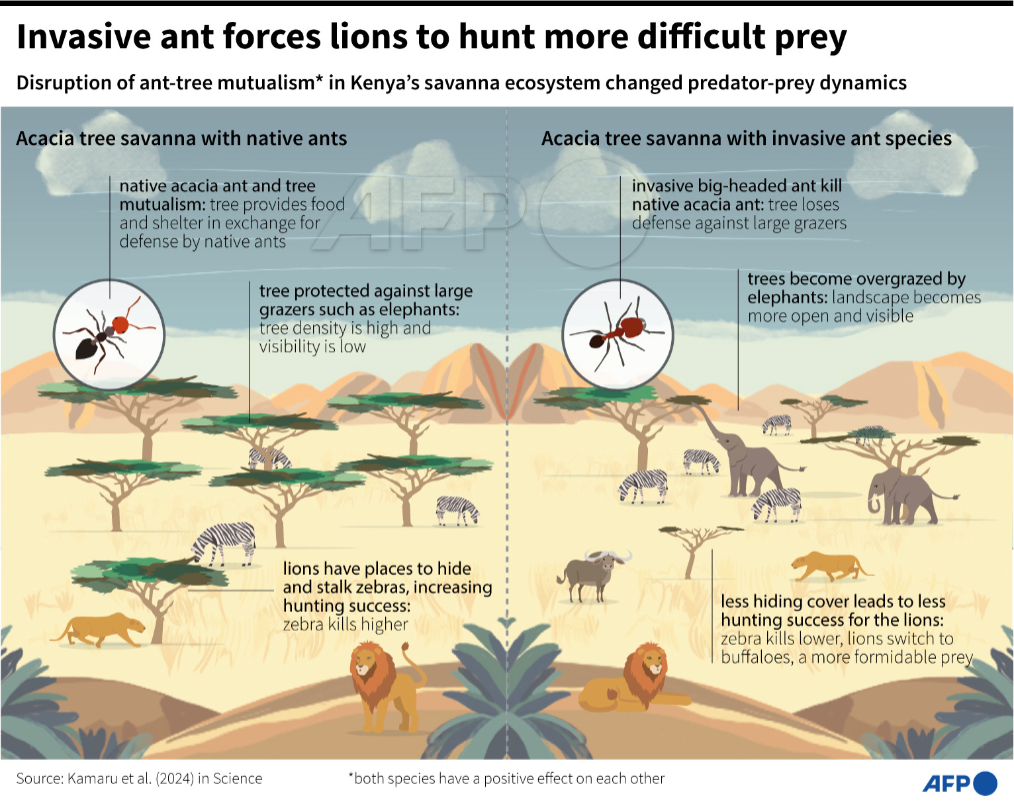
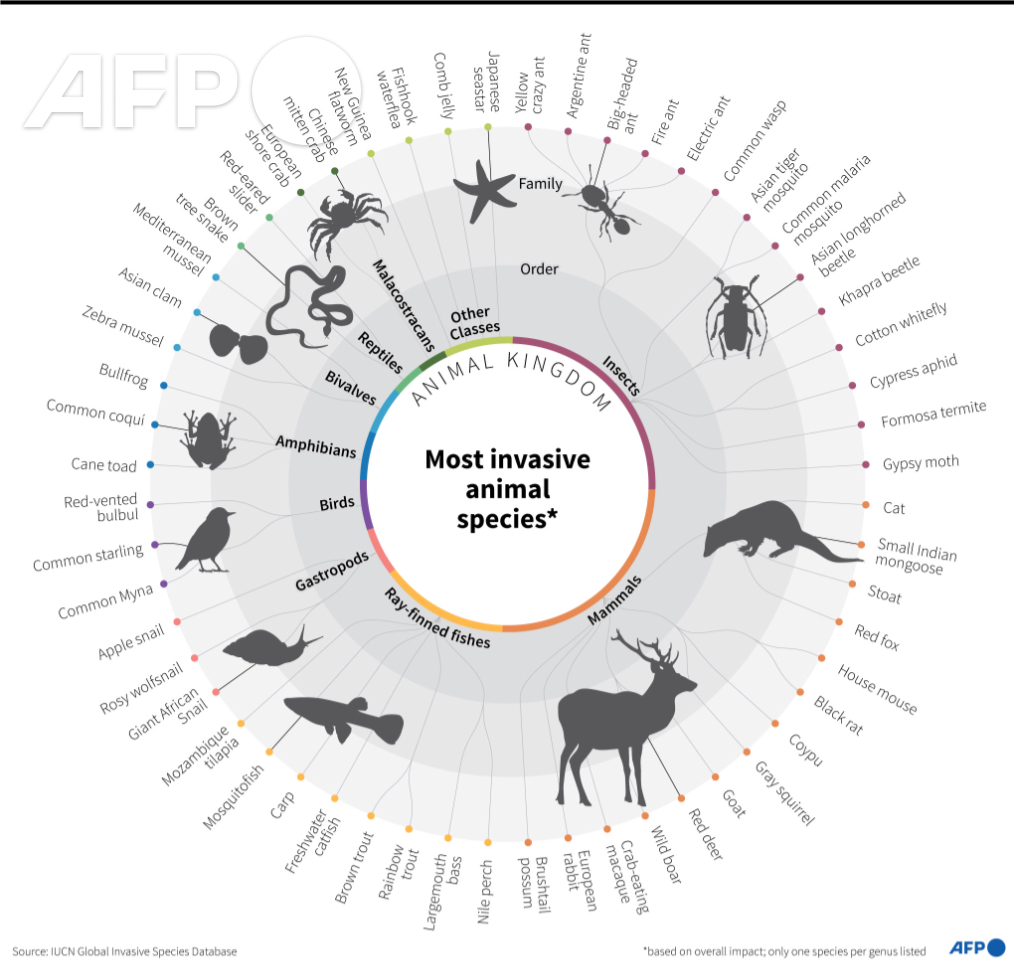
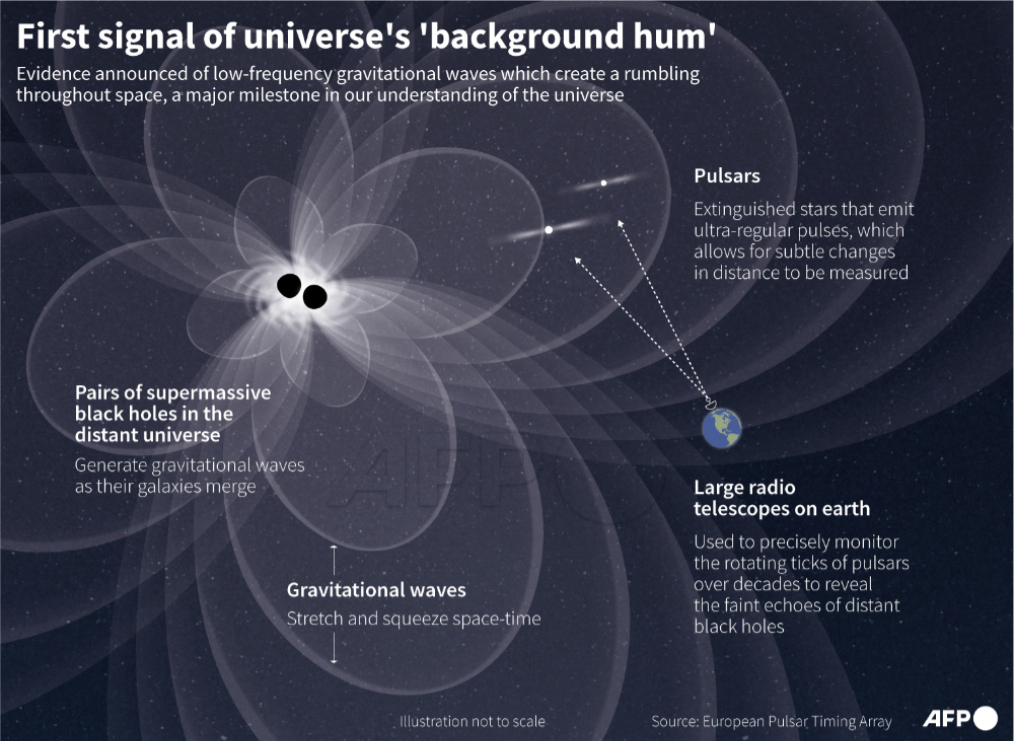
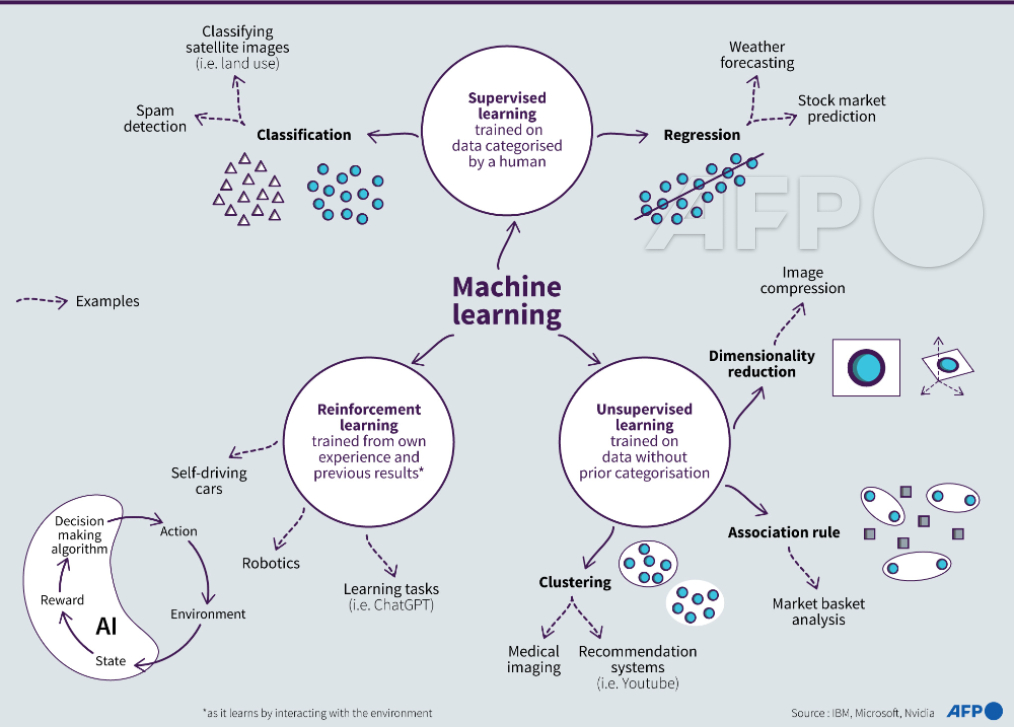
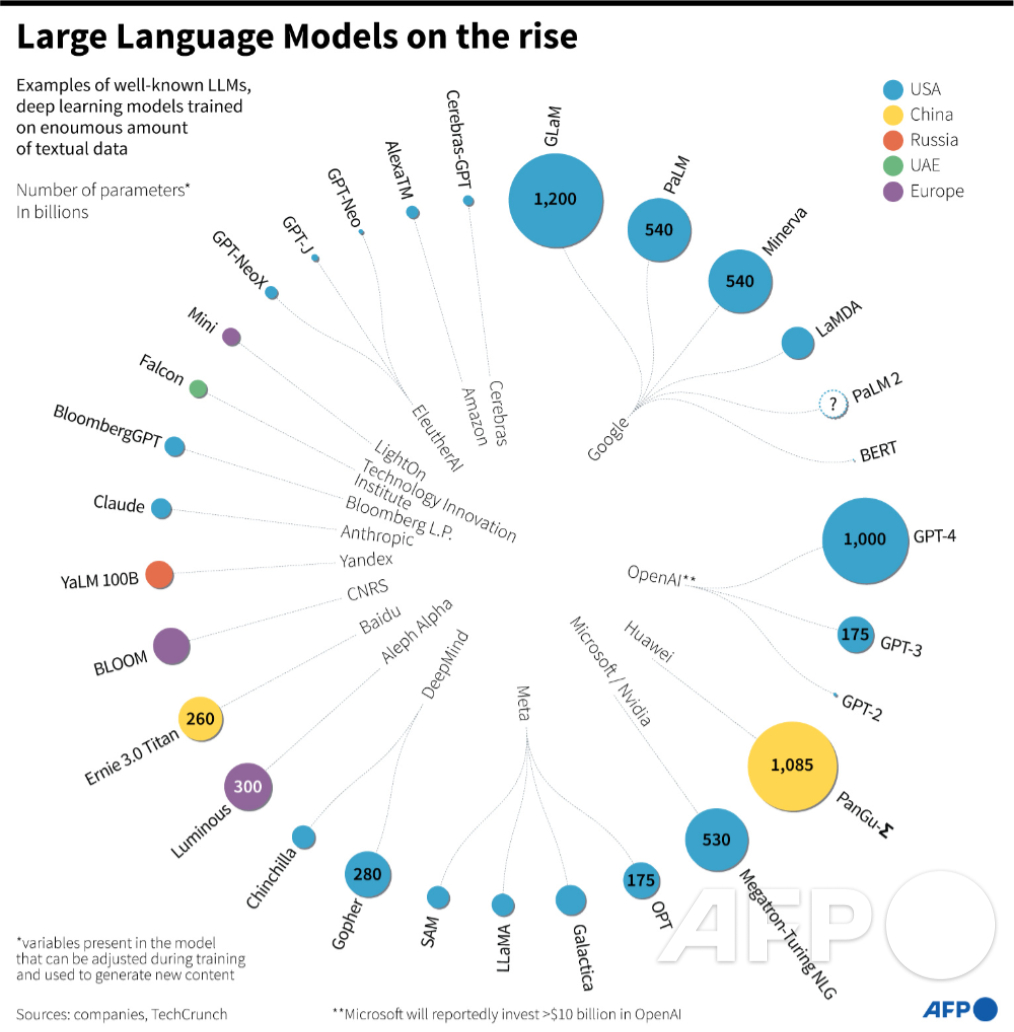
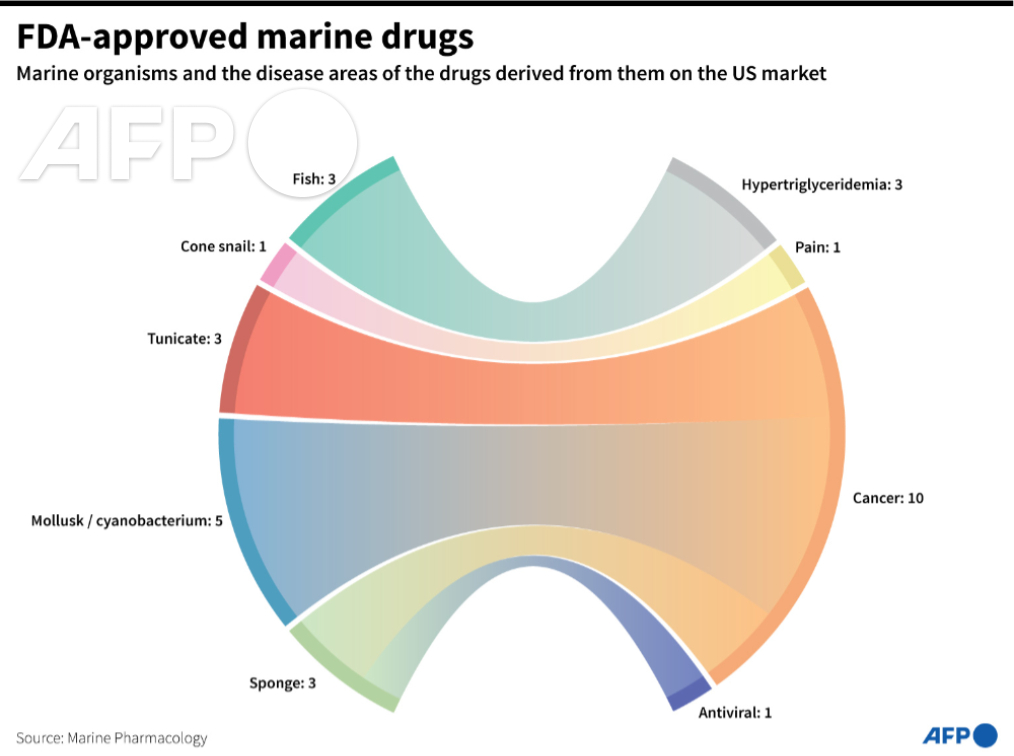
Selected work AFP: science / tech
Data journalism
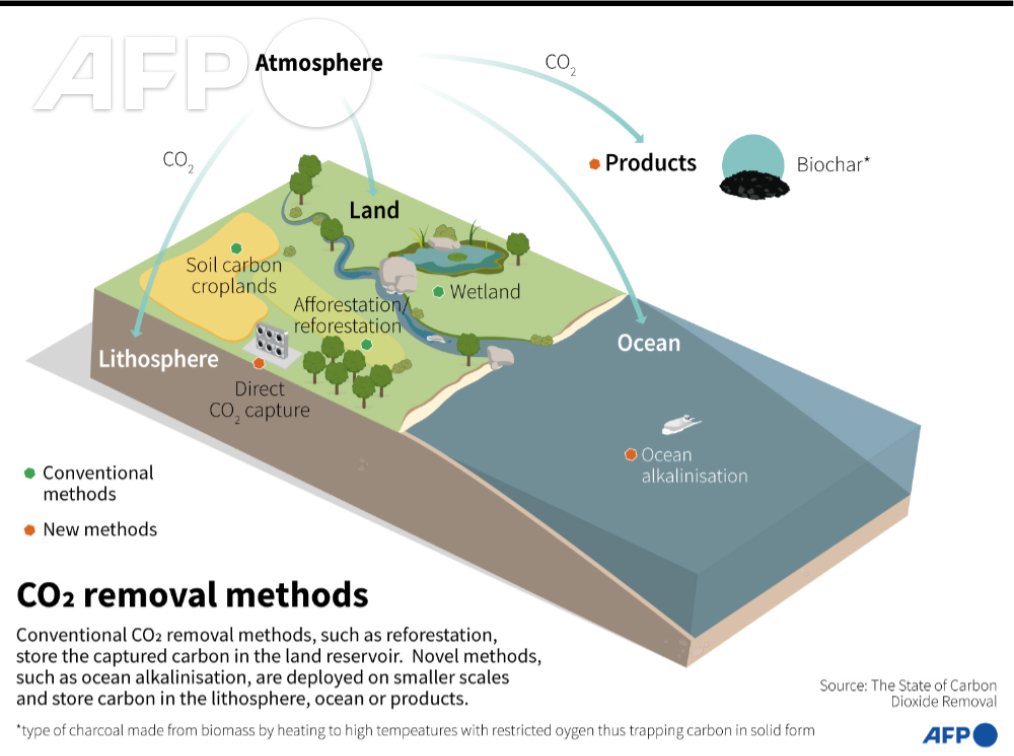
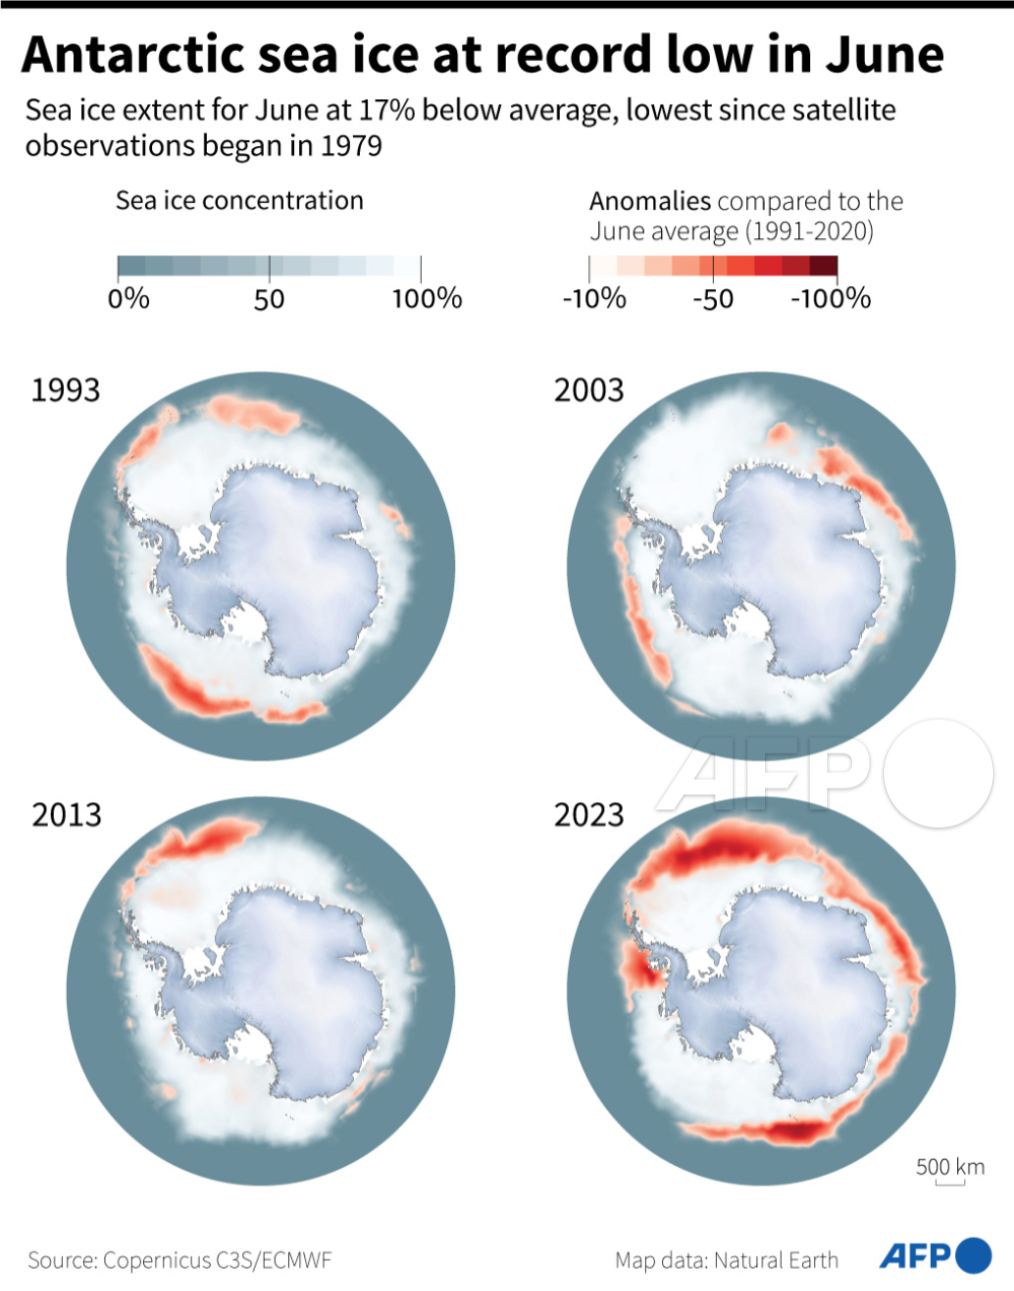
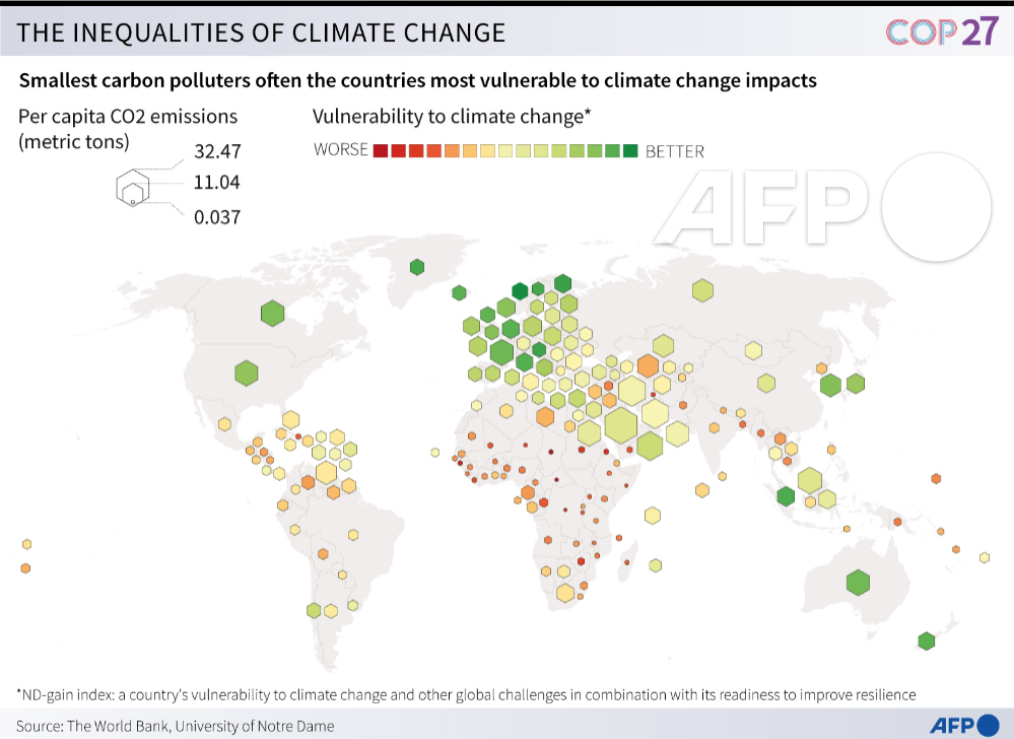
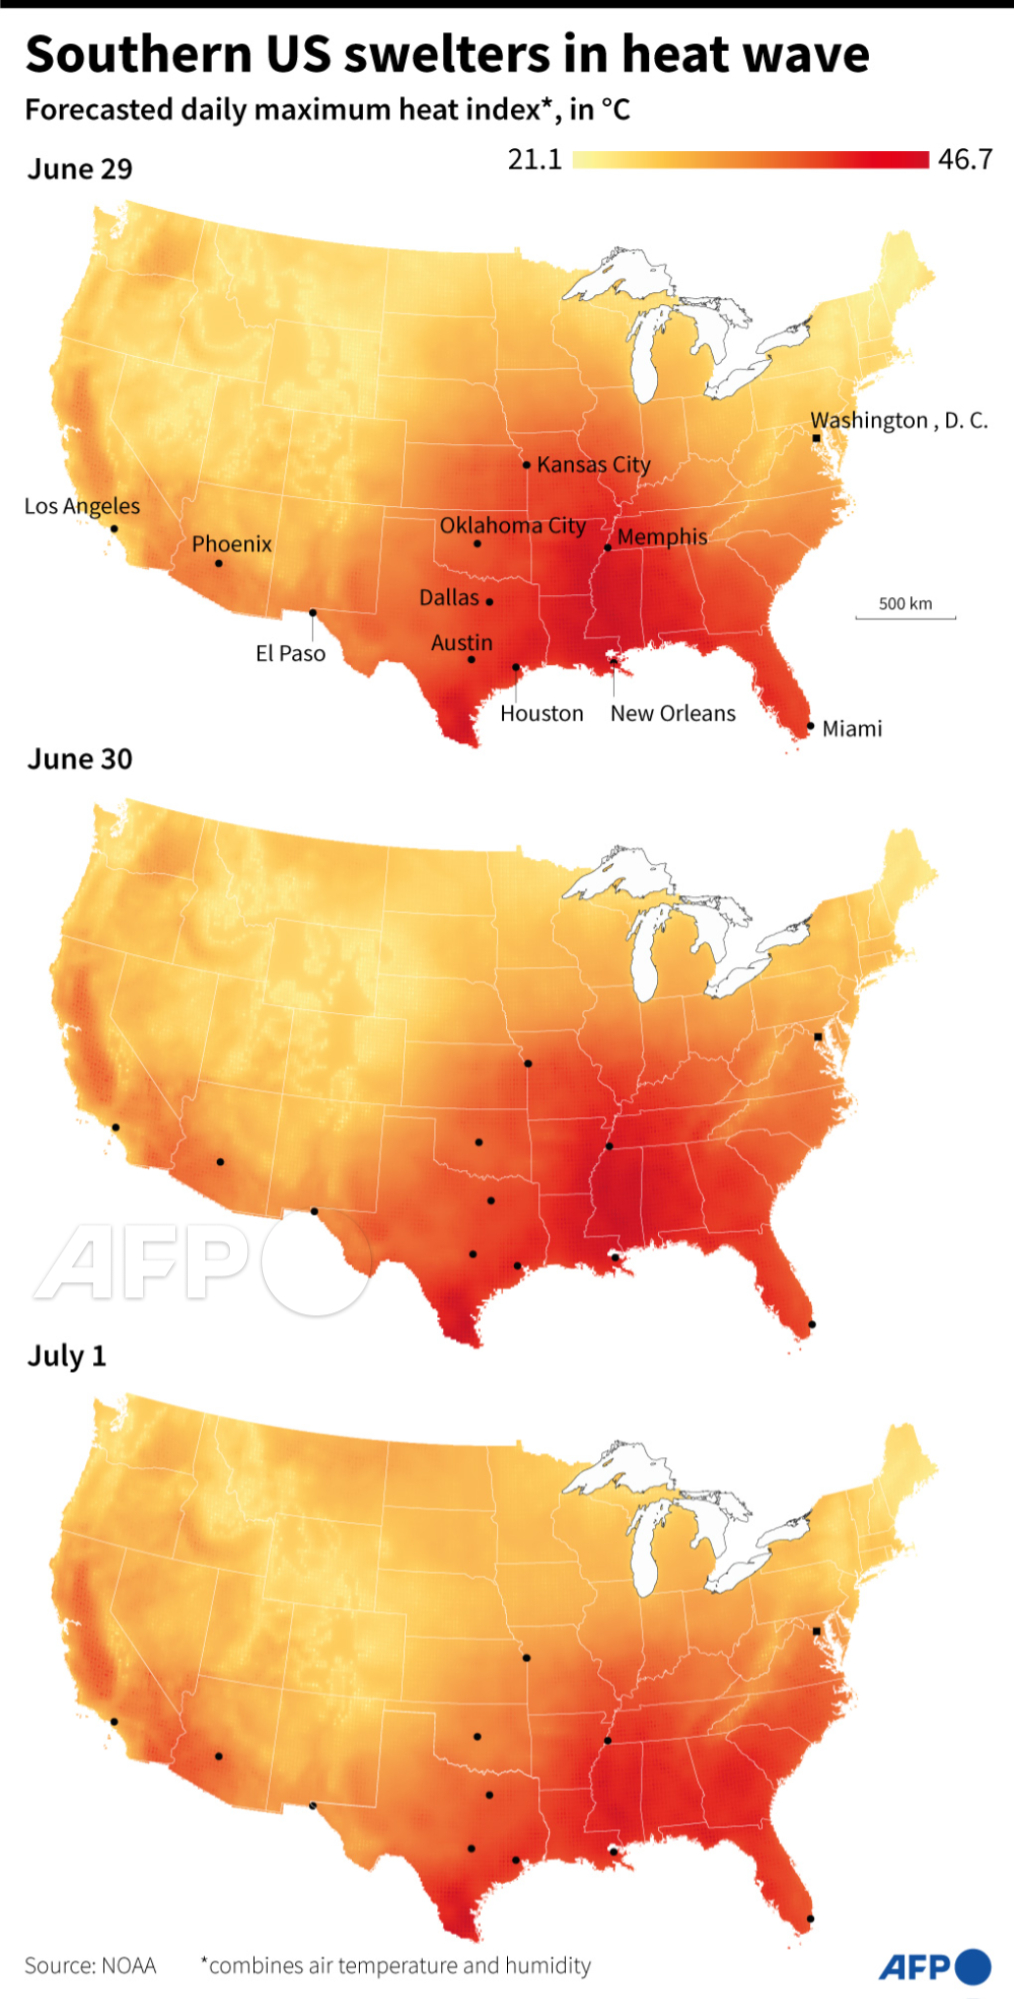
Selected work AFP: climate / env
Data journalism
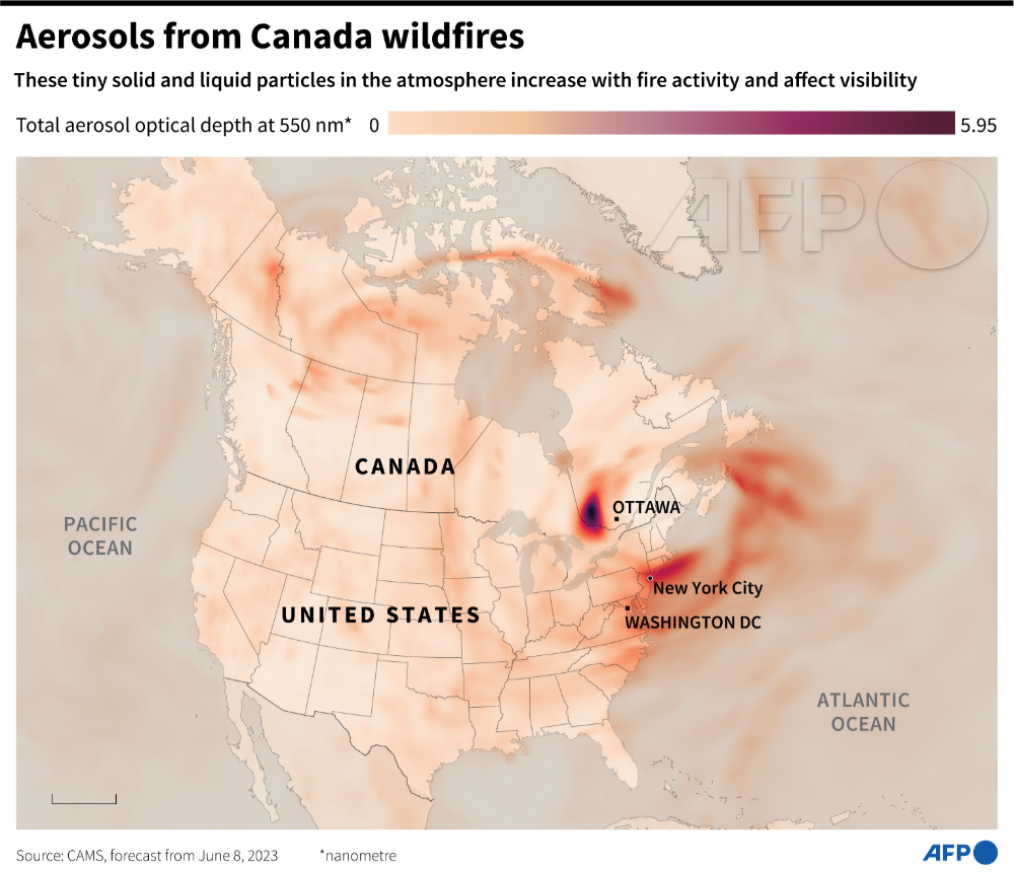
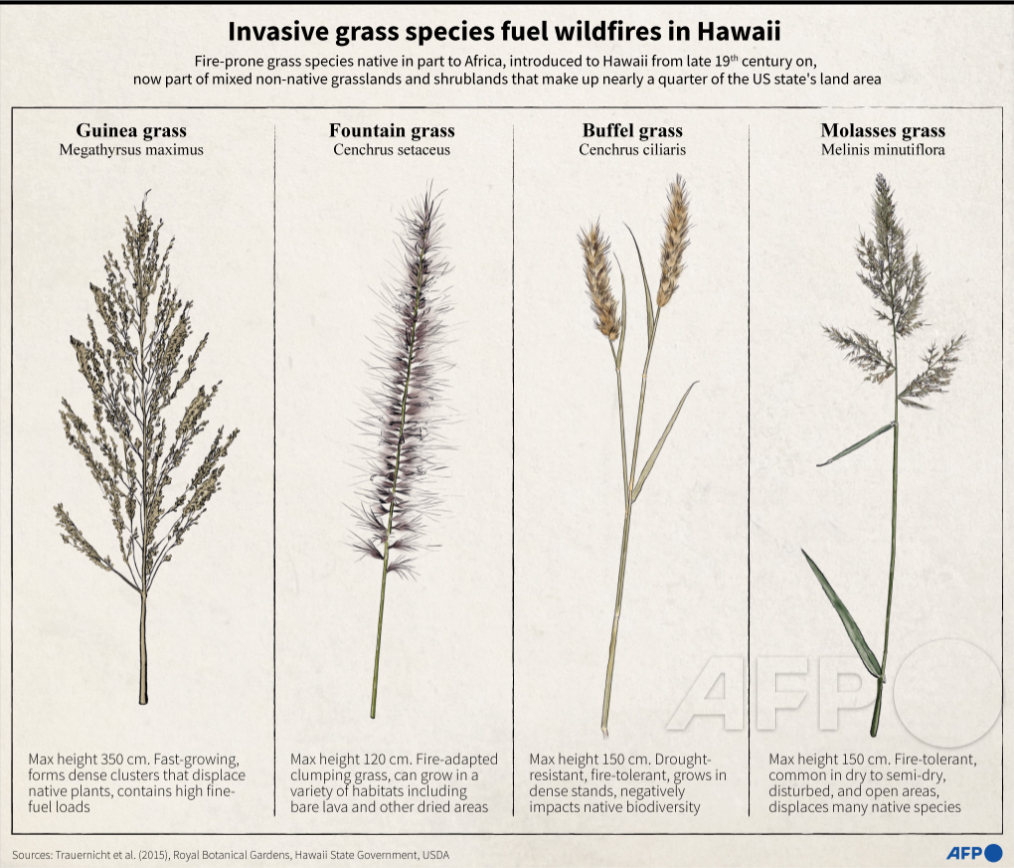
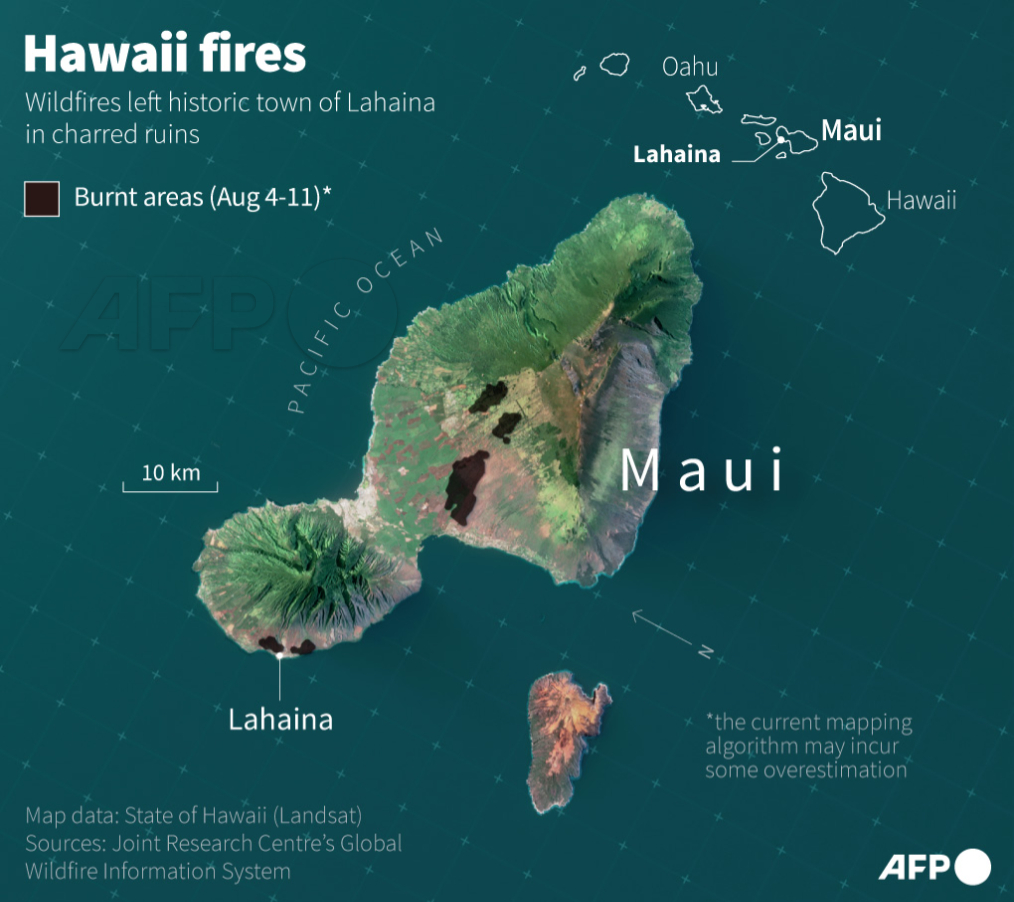
Selected work AFP: fires
Data journalism
Selected work AFP: videos
Data journalism
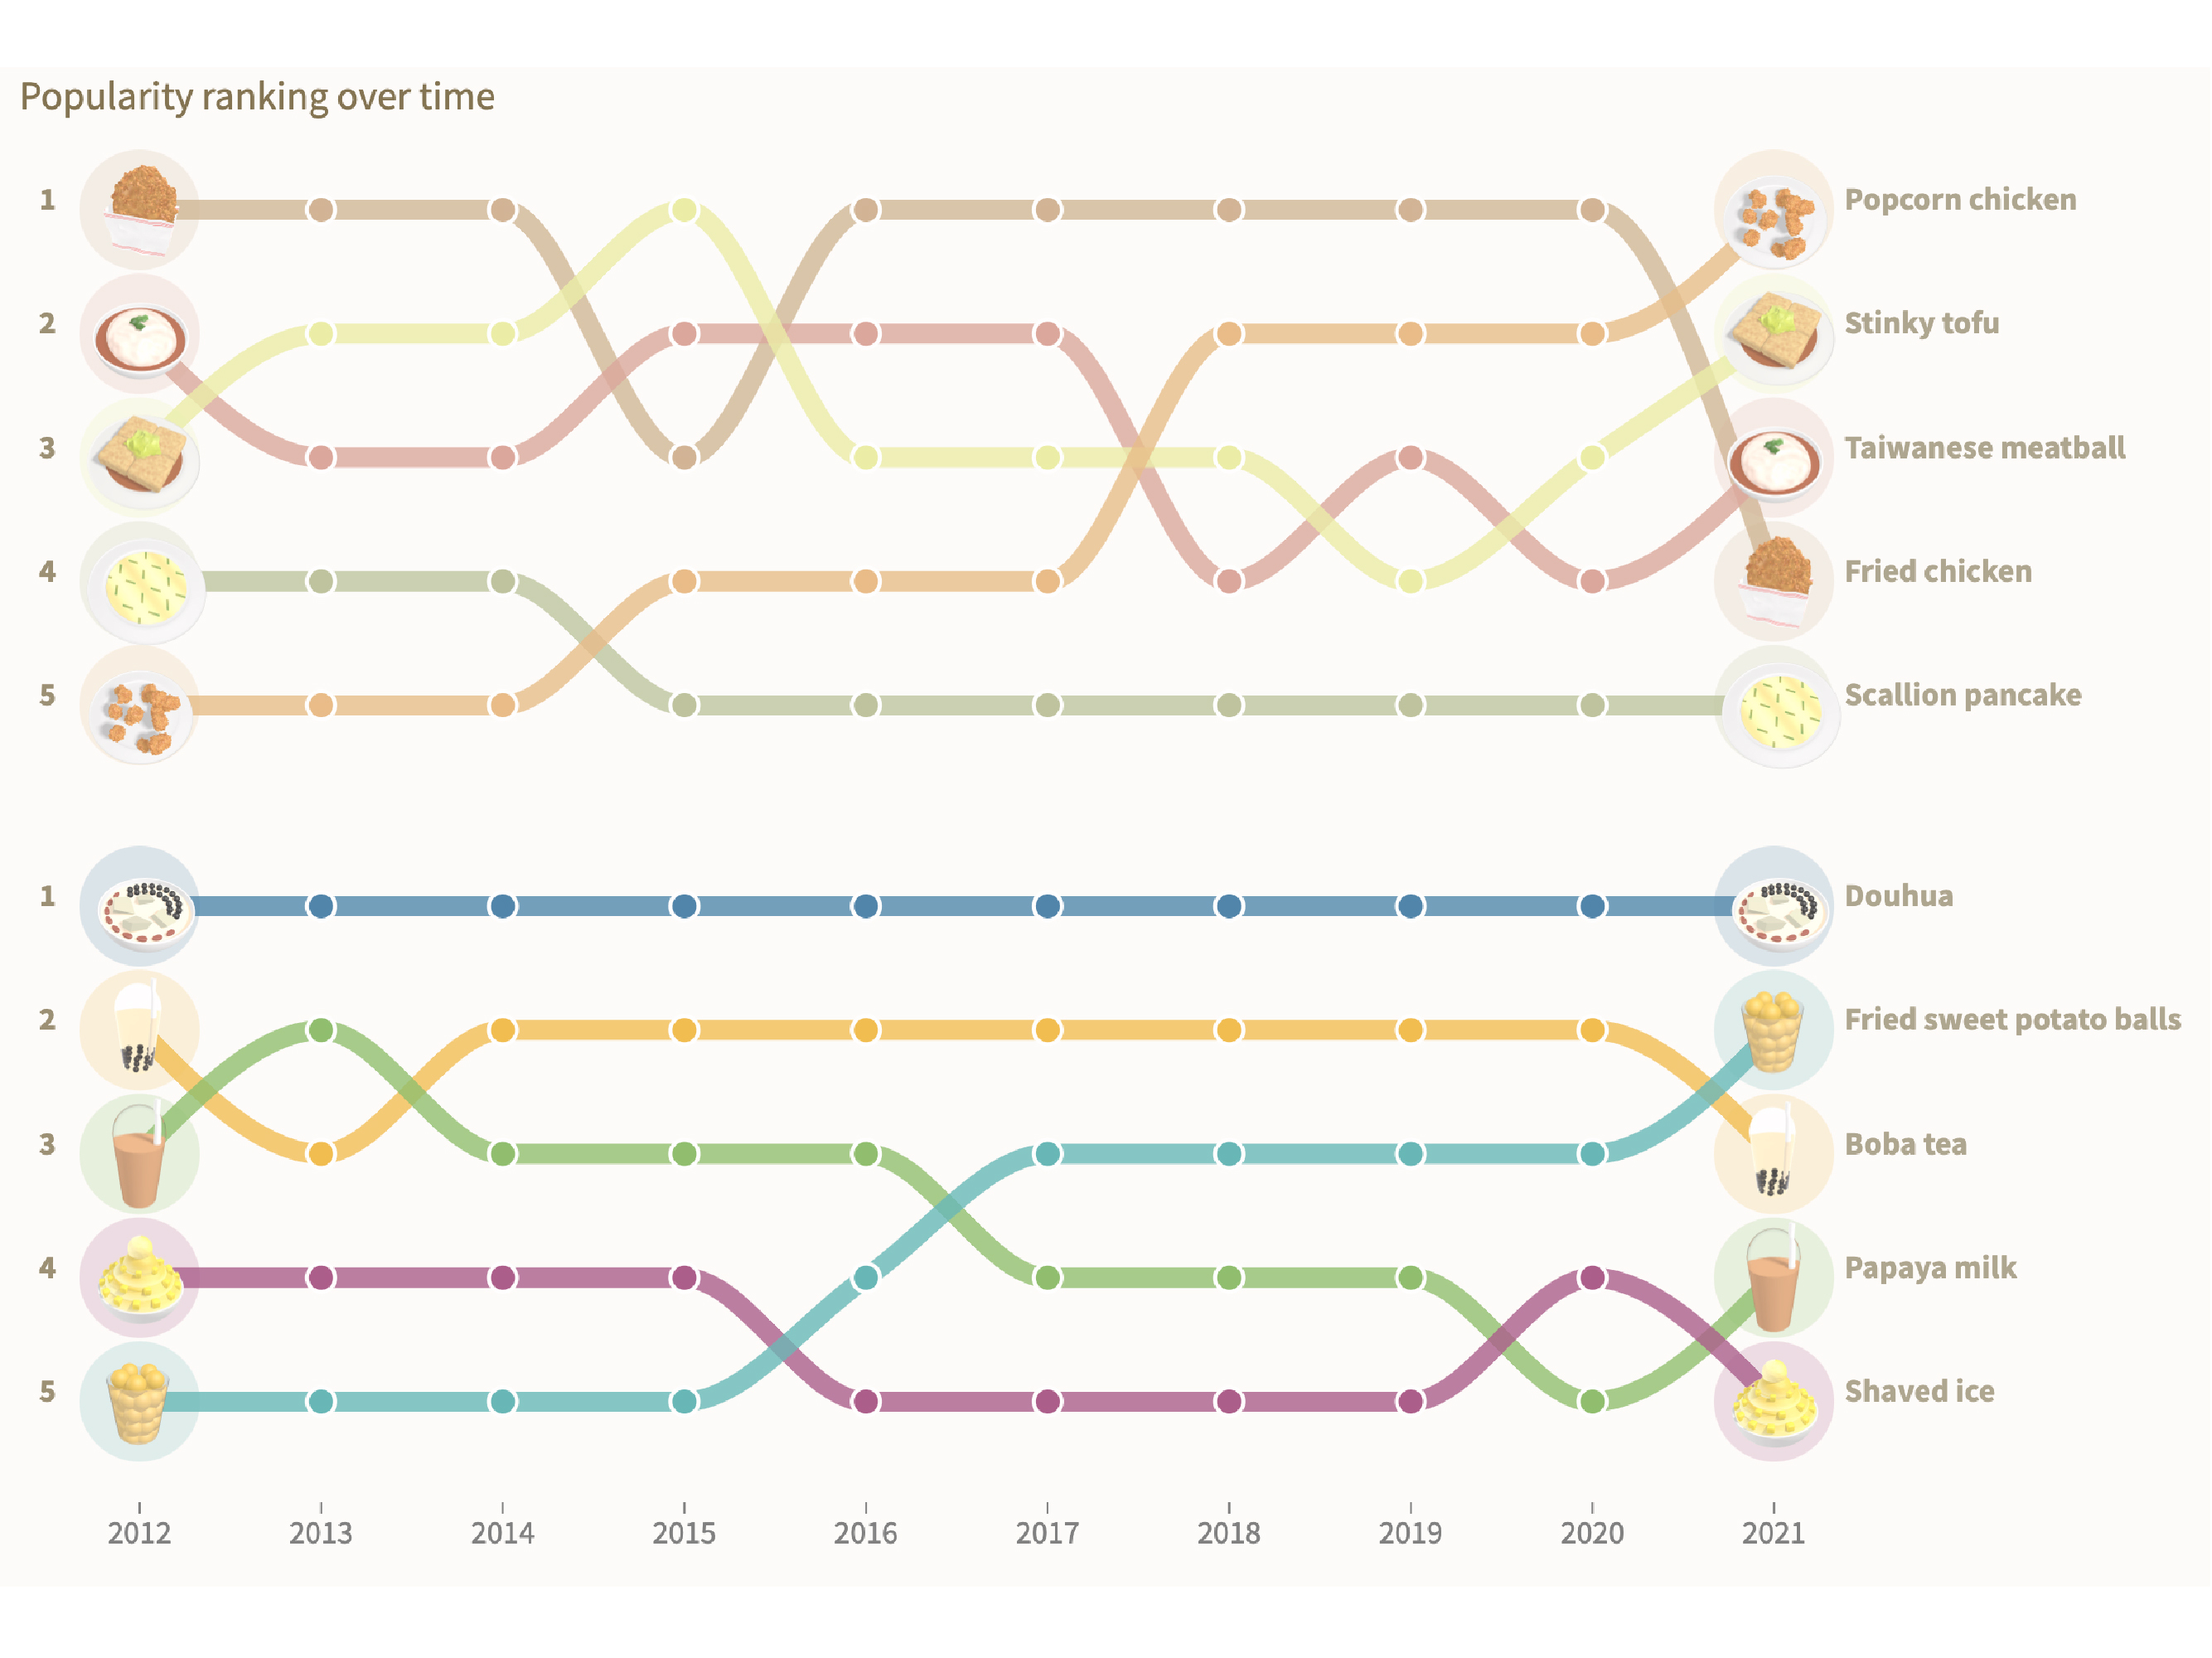
Taiwan’s 10 most popular street foods
Data storytelling
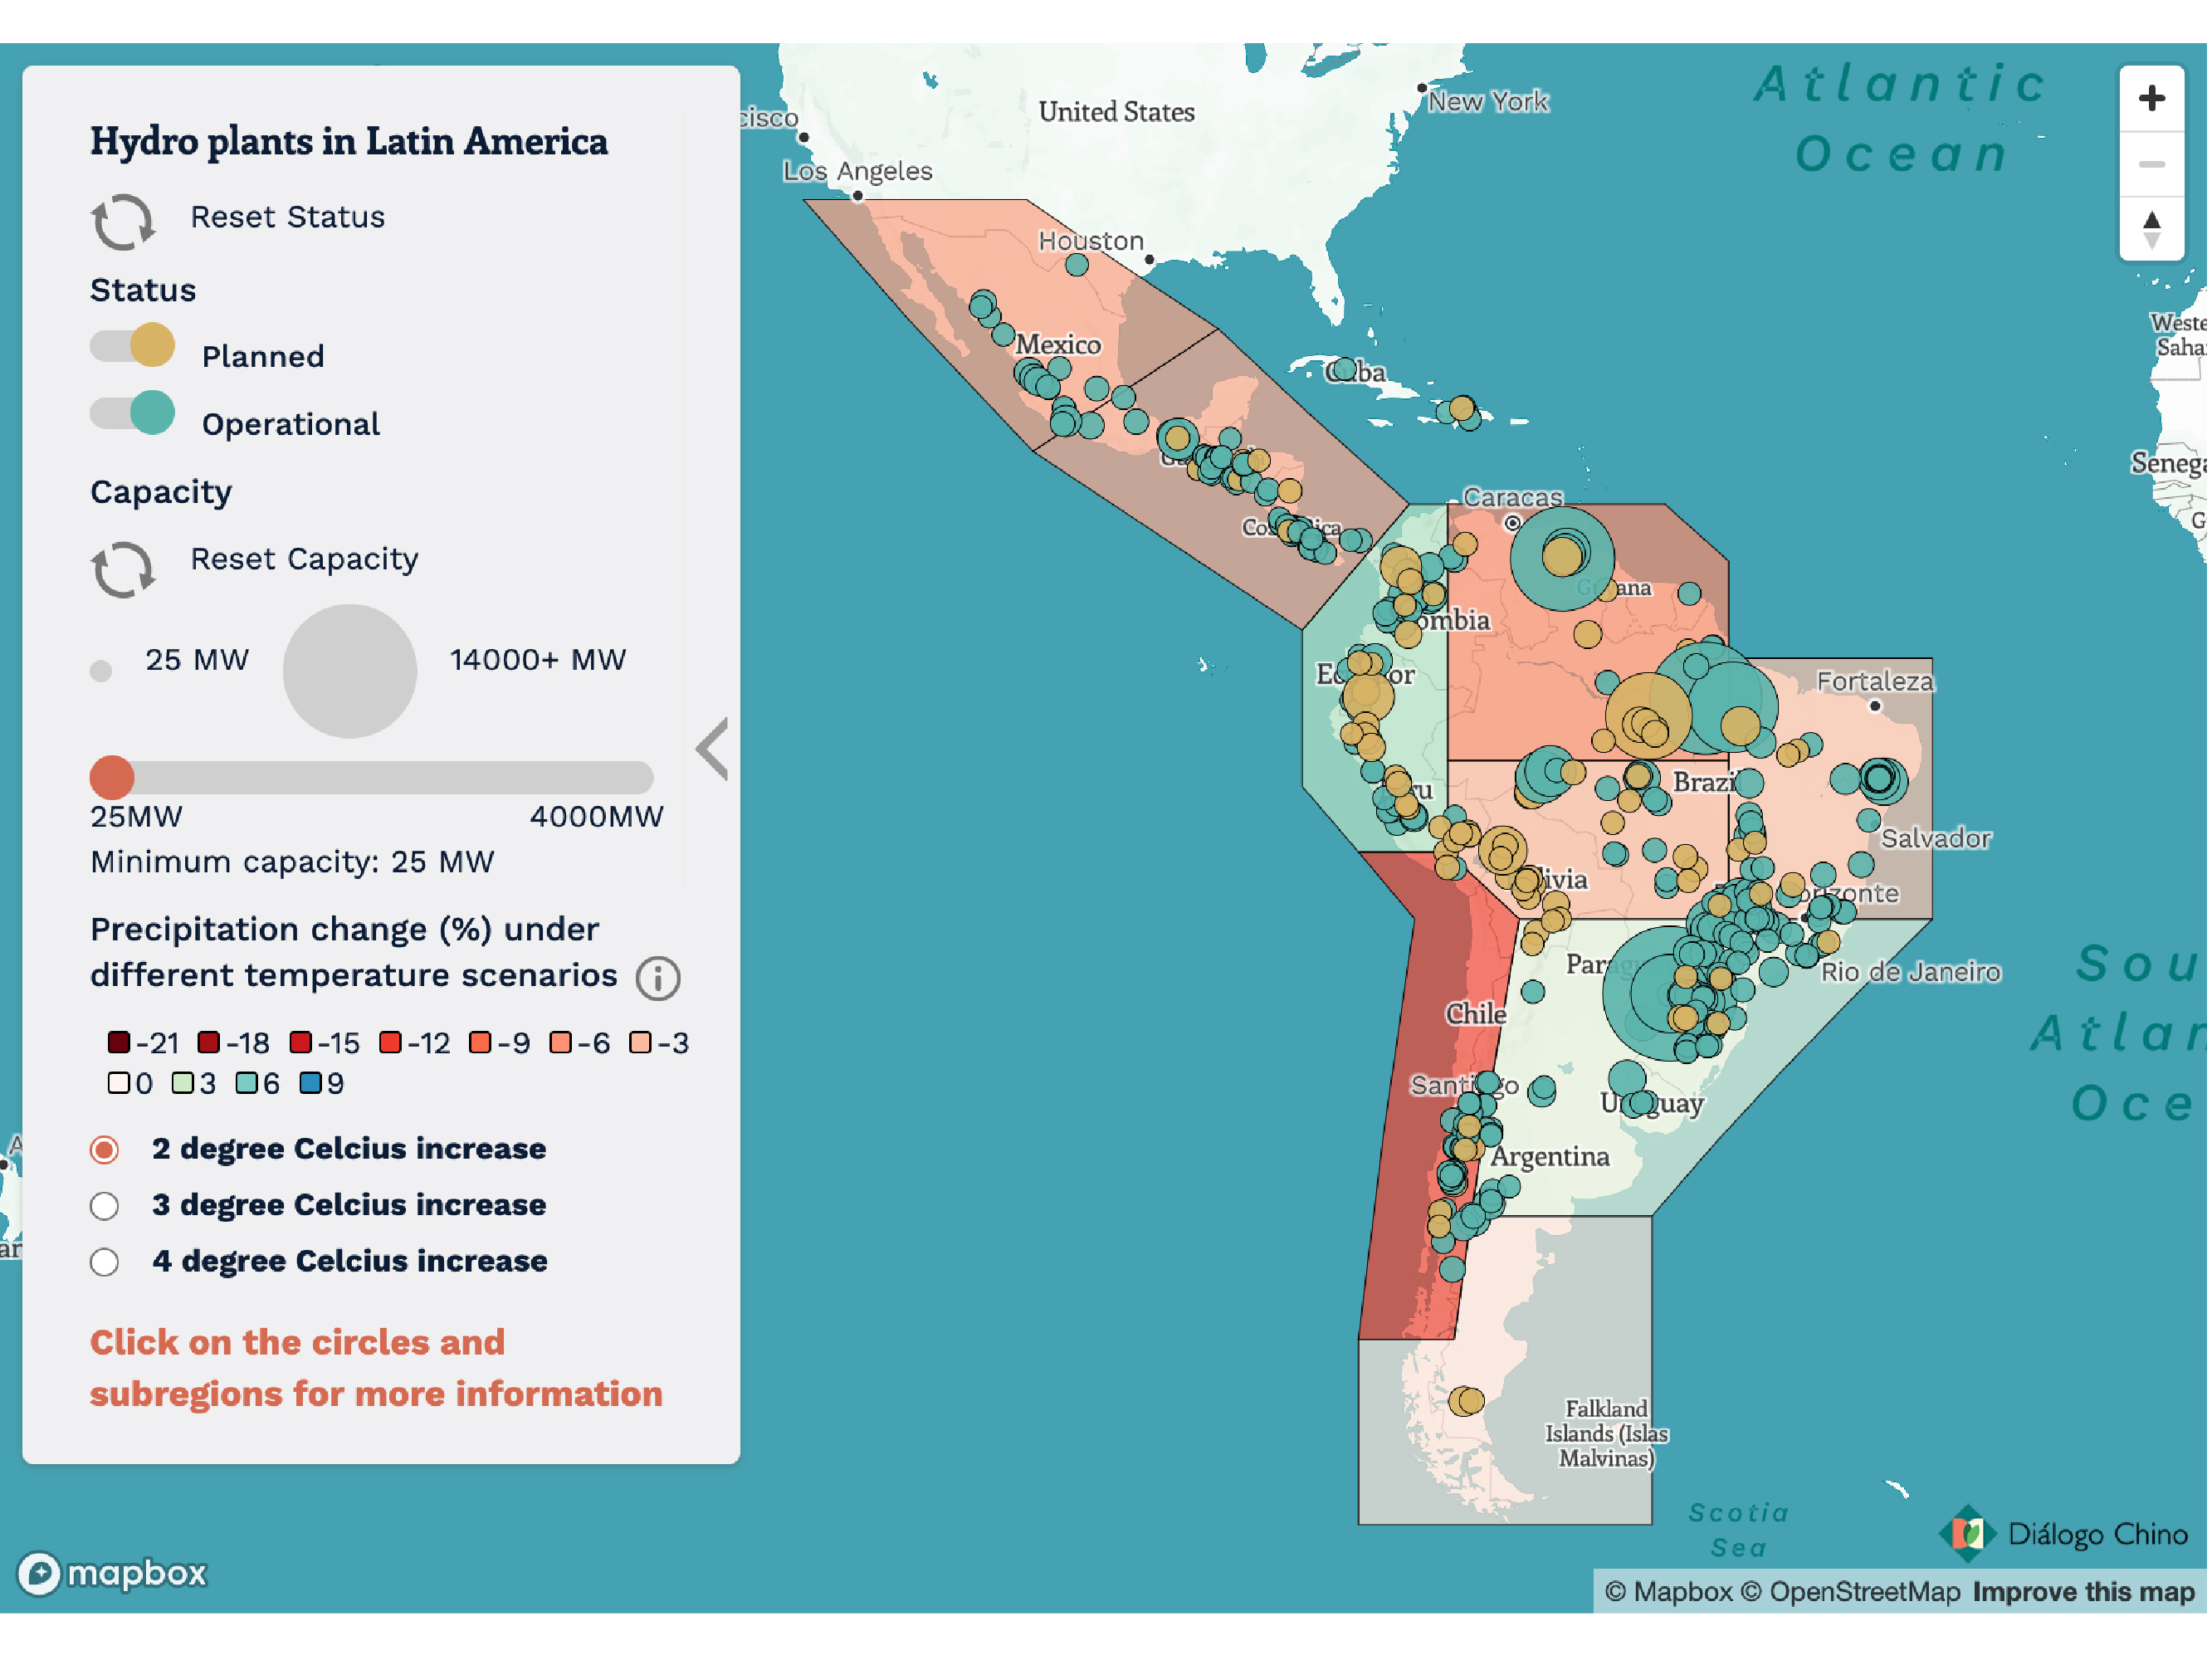
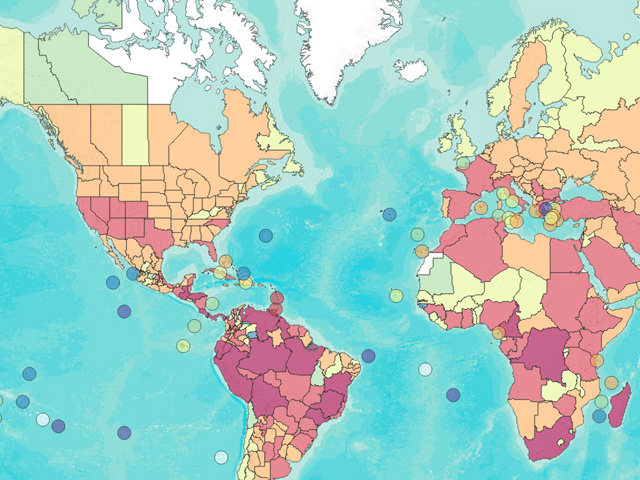
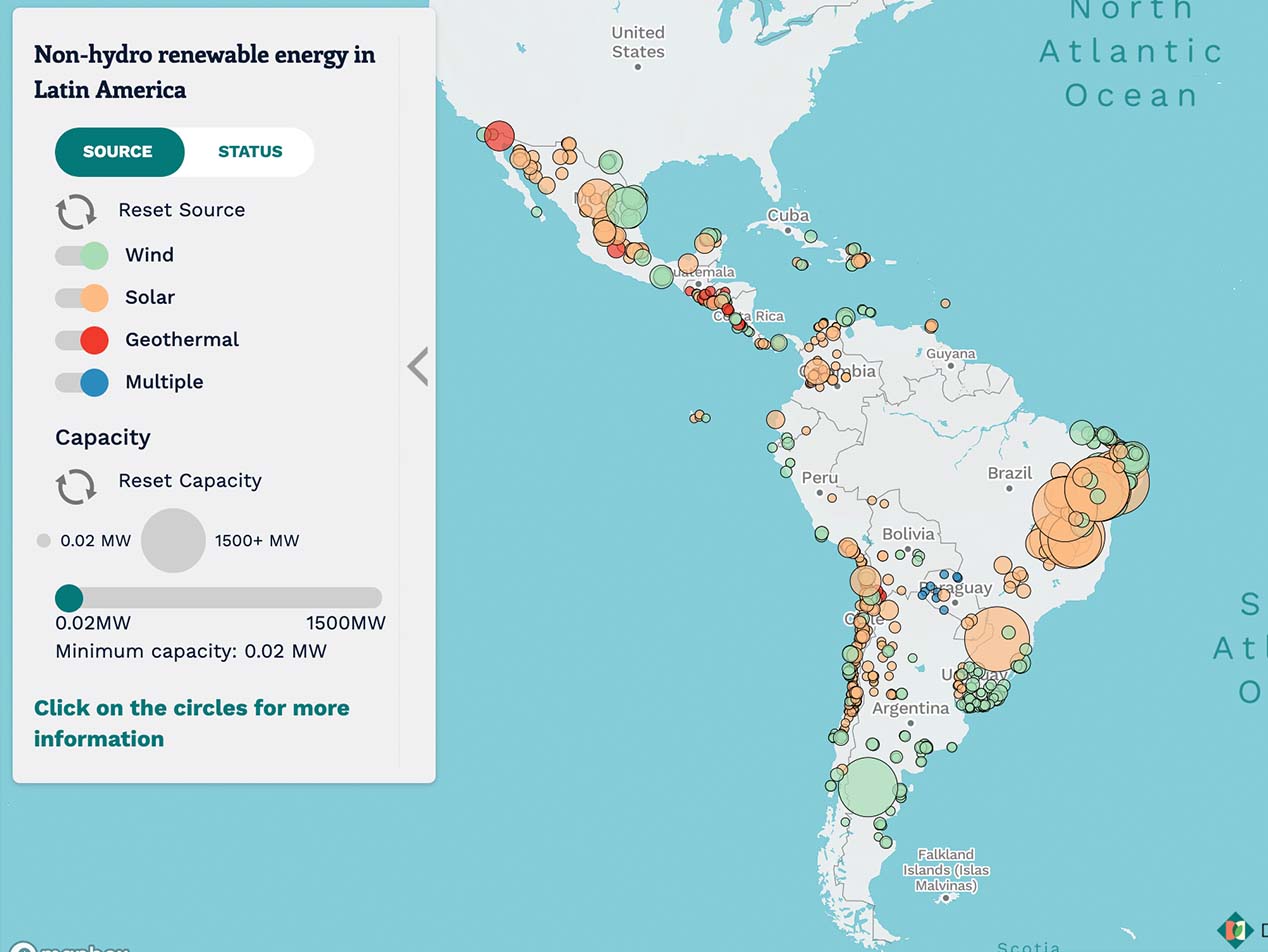
The climate crisis and Latin American hydropower
Exploratory tool, Interactive map
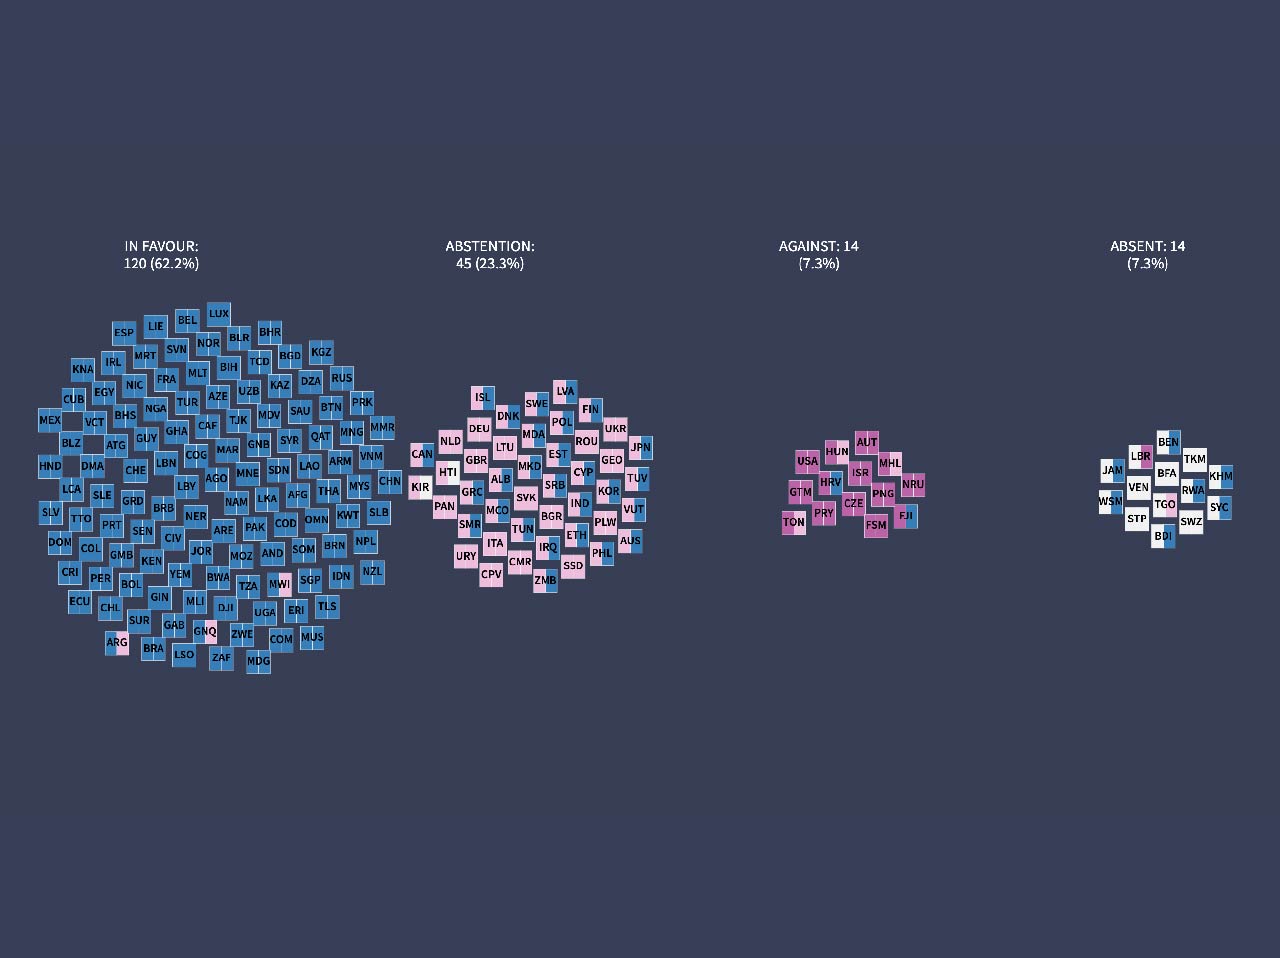
UN votes on Ukraine and Gaza
Decided to turn static graphics at work into interactives series...
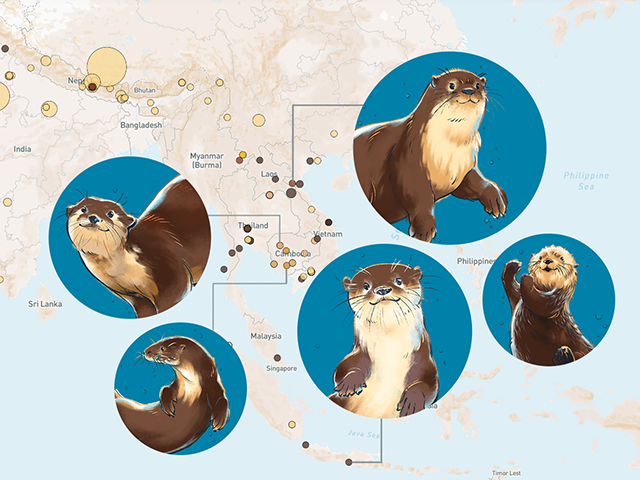
Wild otters - threatened & traded
Data journalism
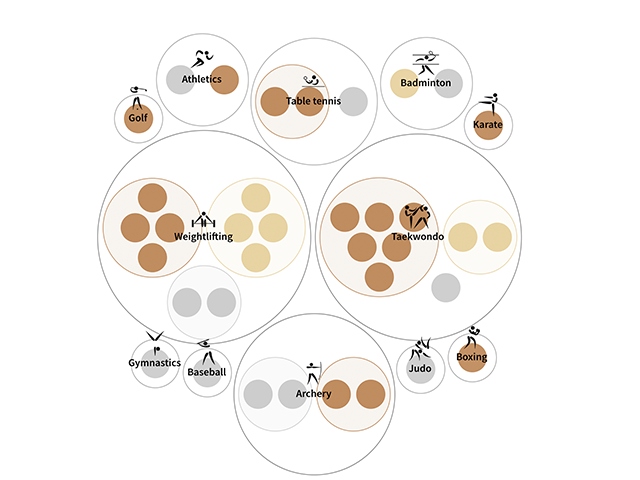
Taiwan's 36 Olympic medals
Data storytelling
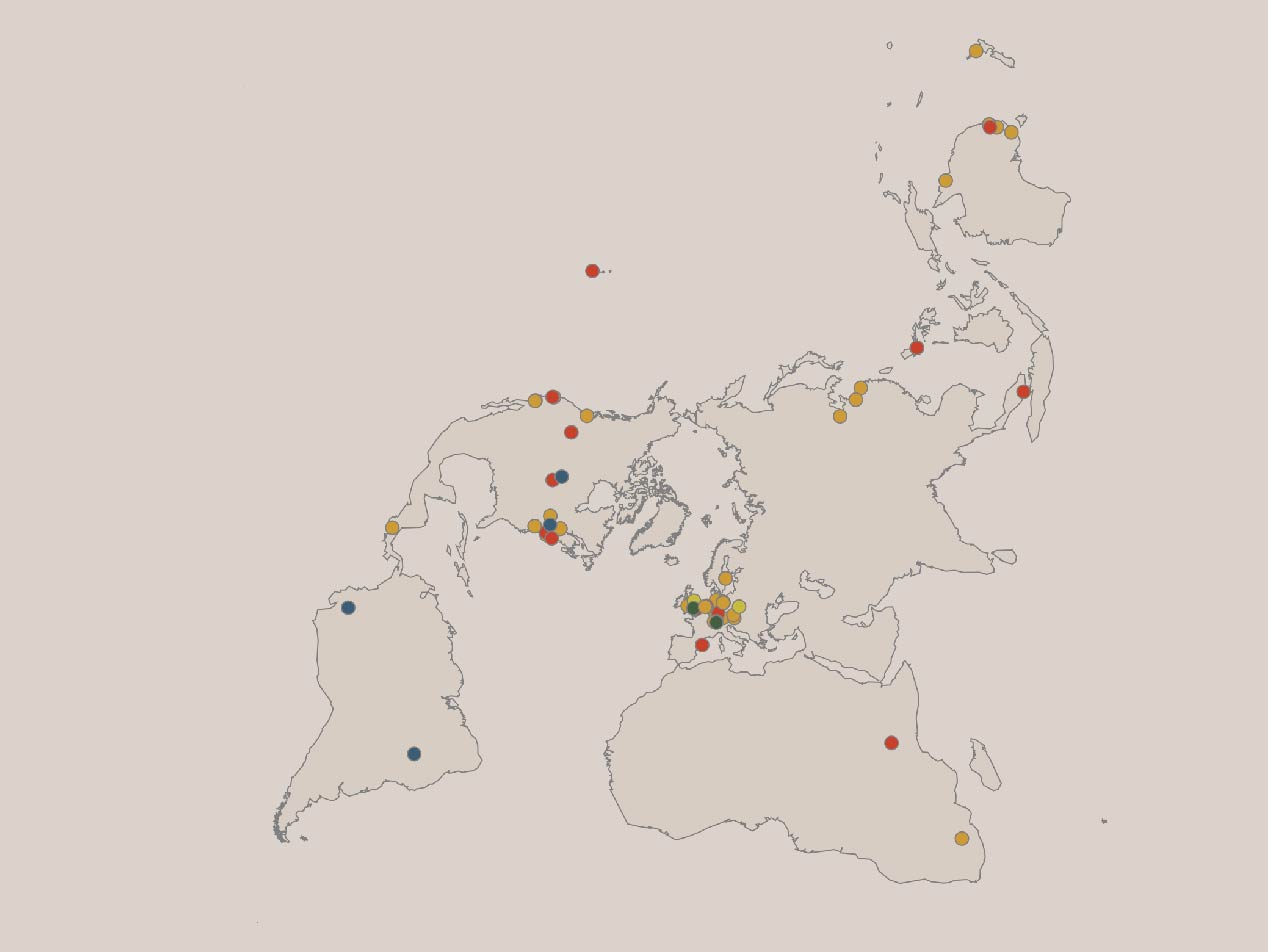
Web map: antmaps.org
Exploratory tool, Web development
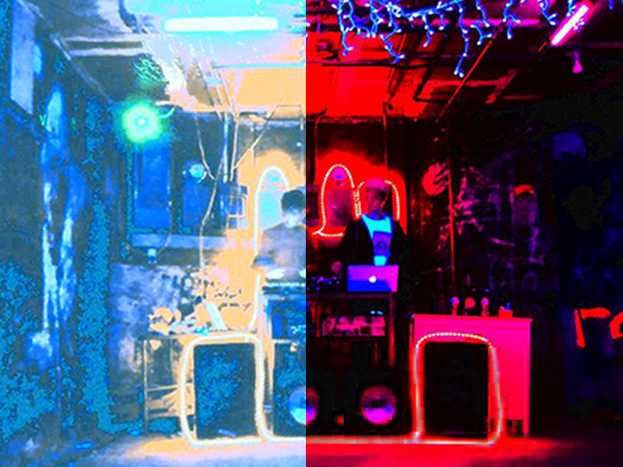
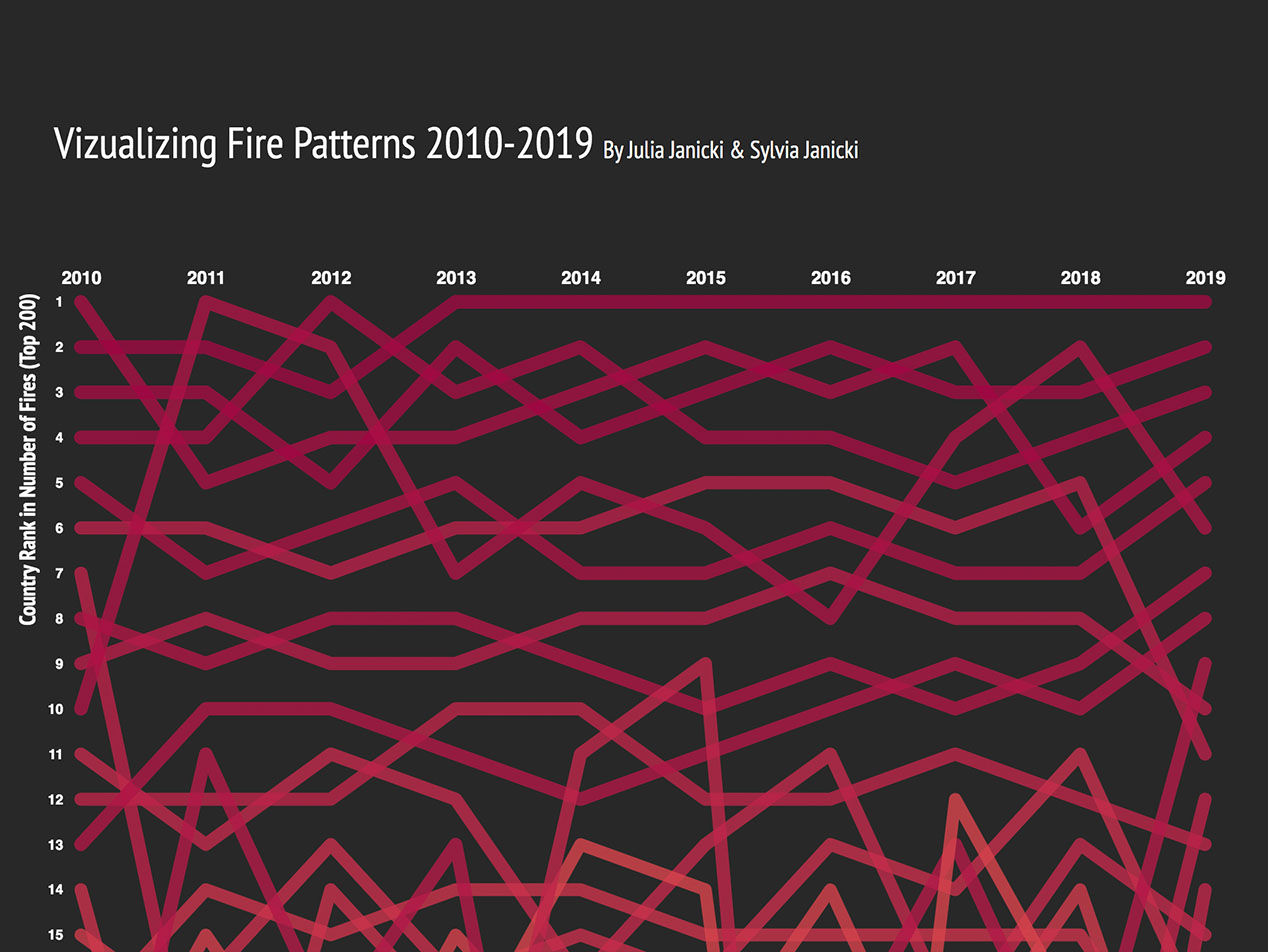
Interactive Visulization Scorched Earth
Interactive storytelling, Data Viz
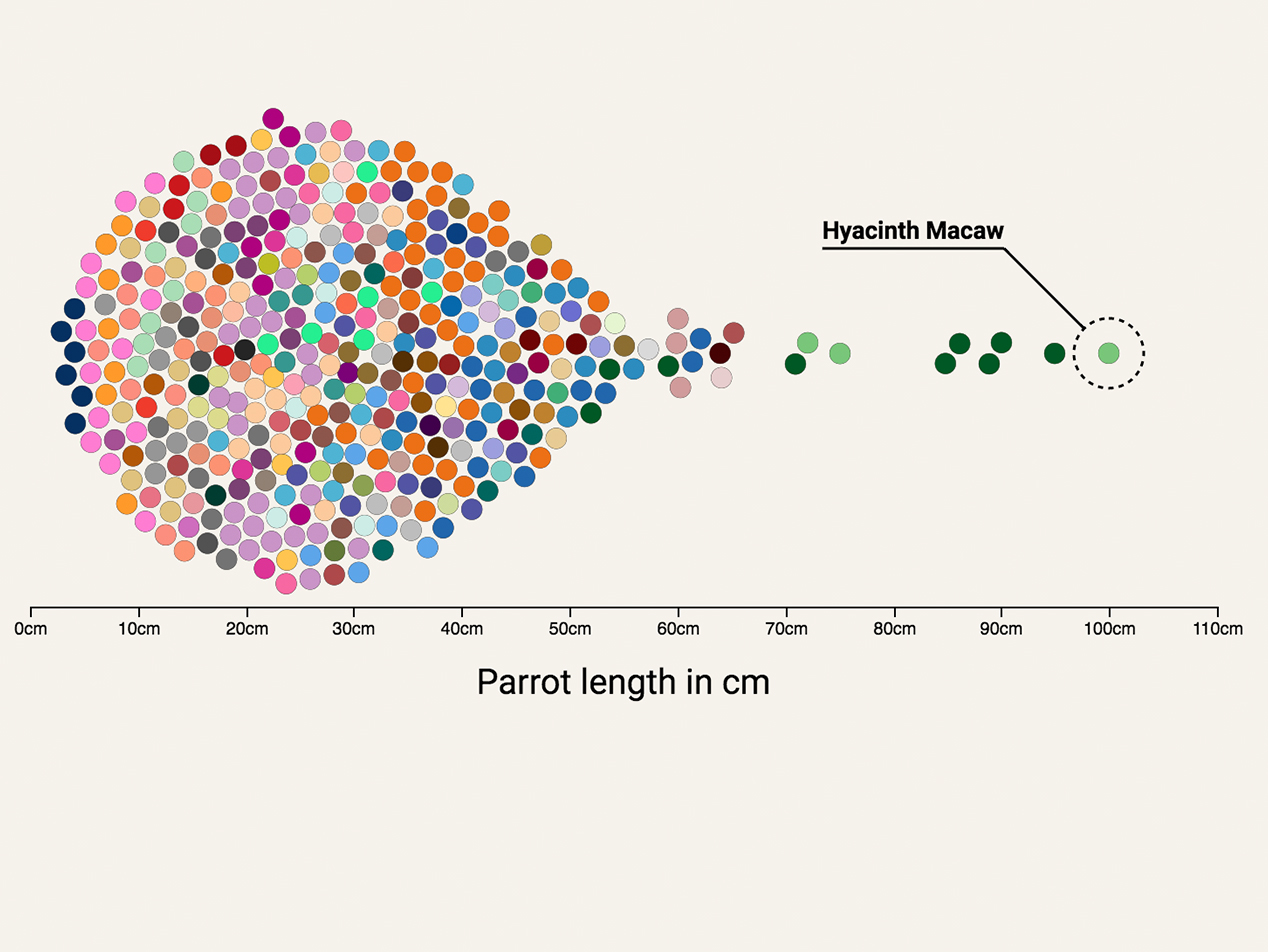
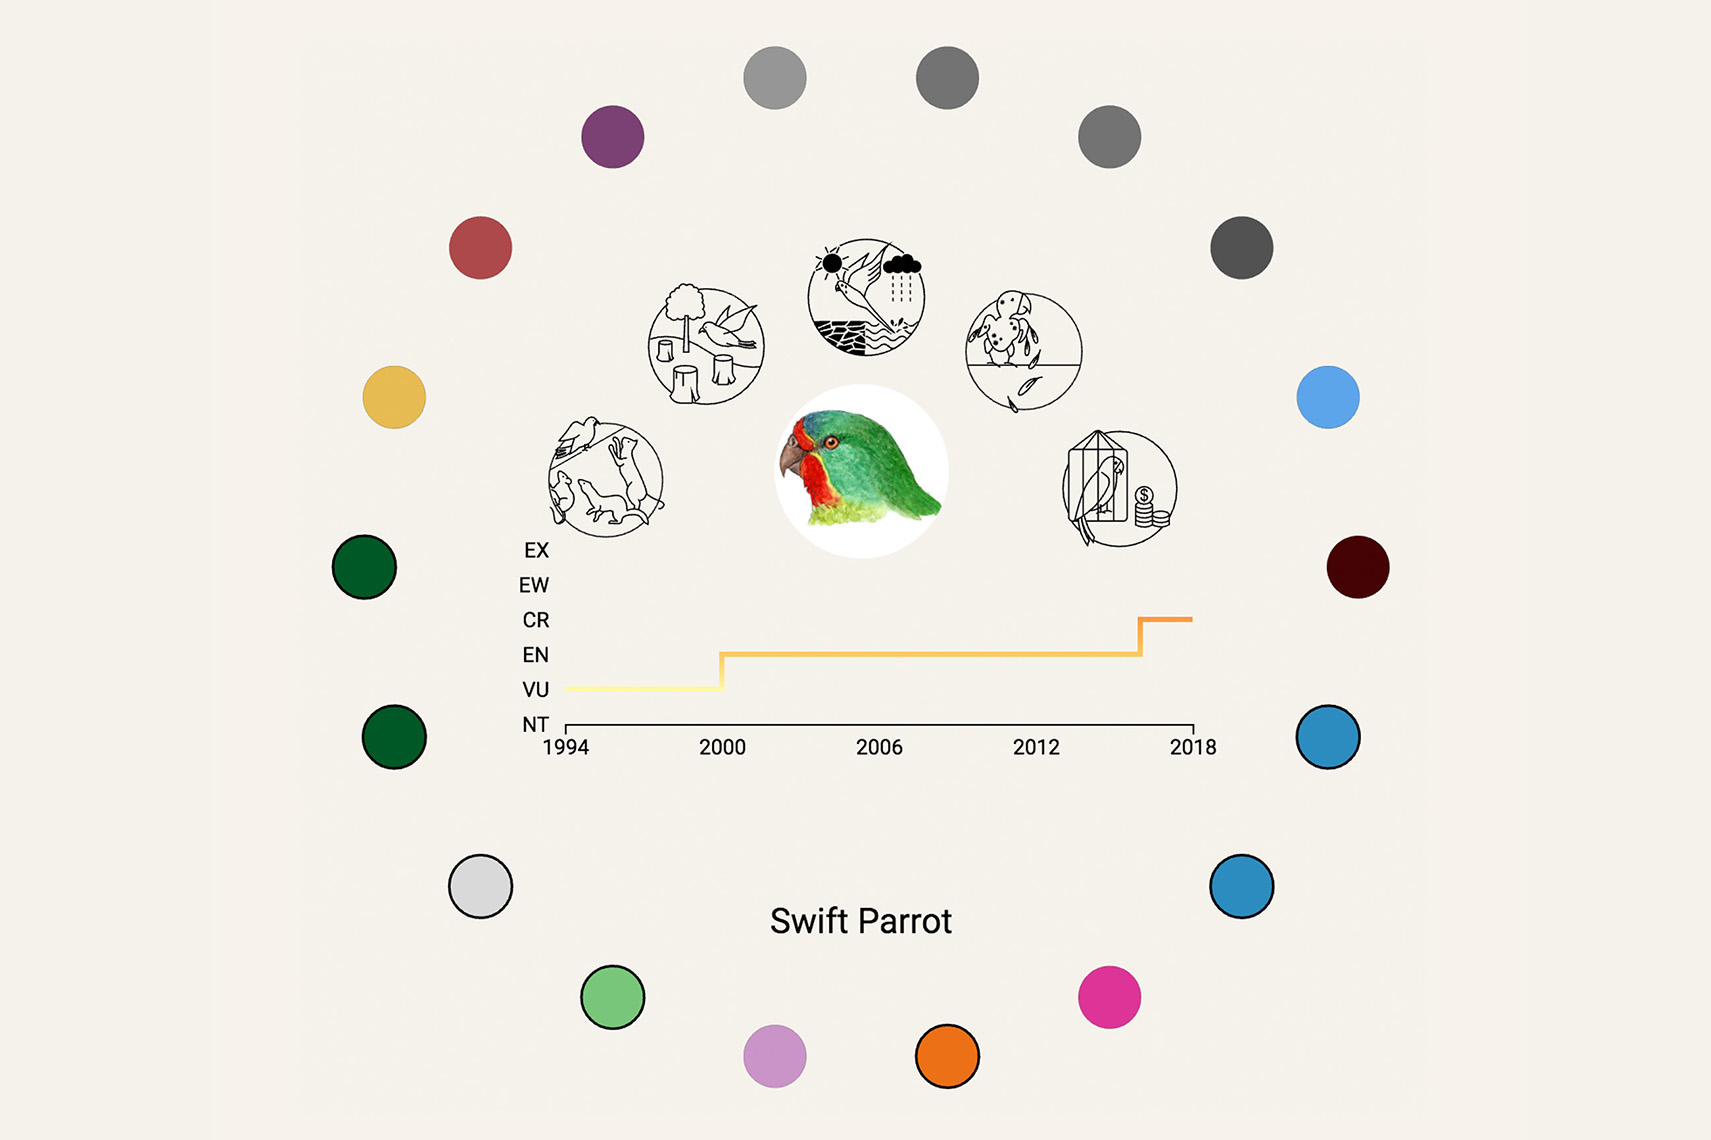
Interactive Visualization: The Parrot Trade
Interactive storytelling
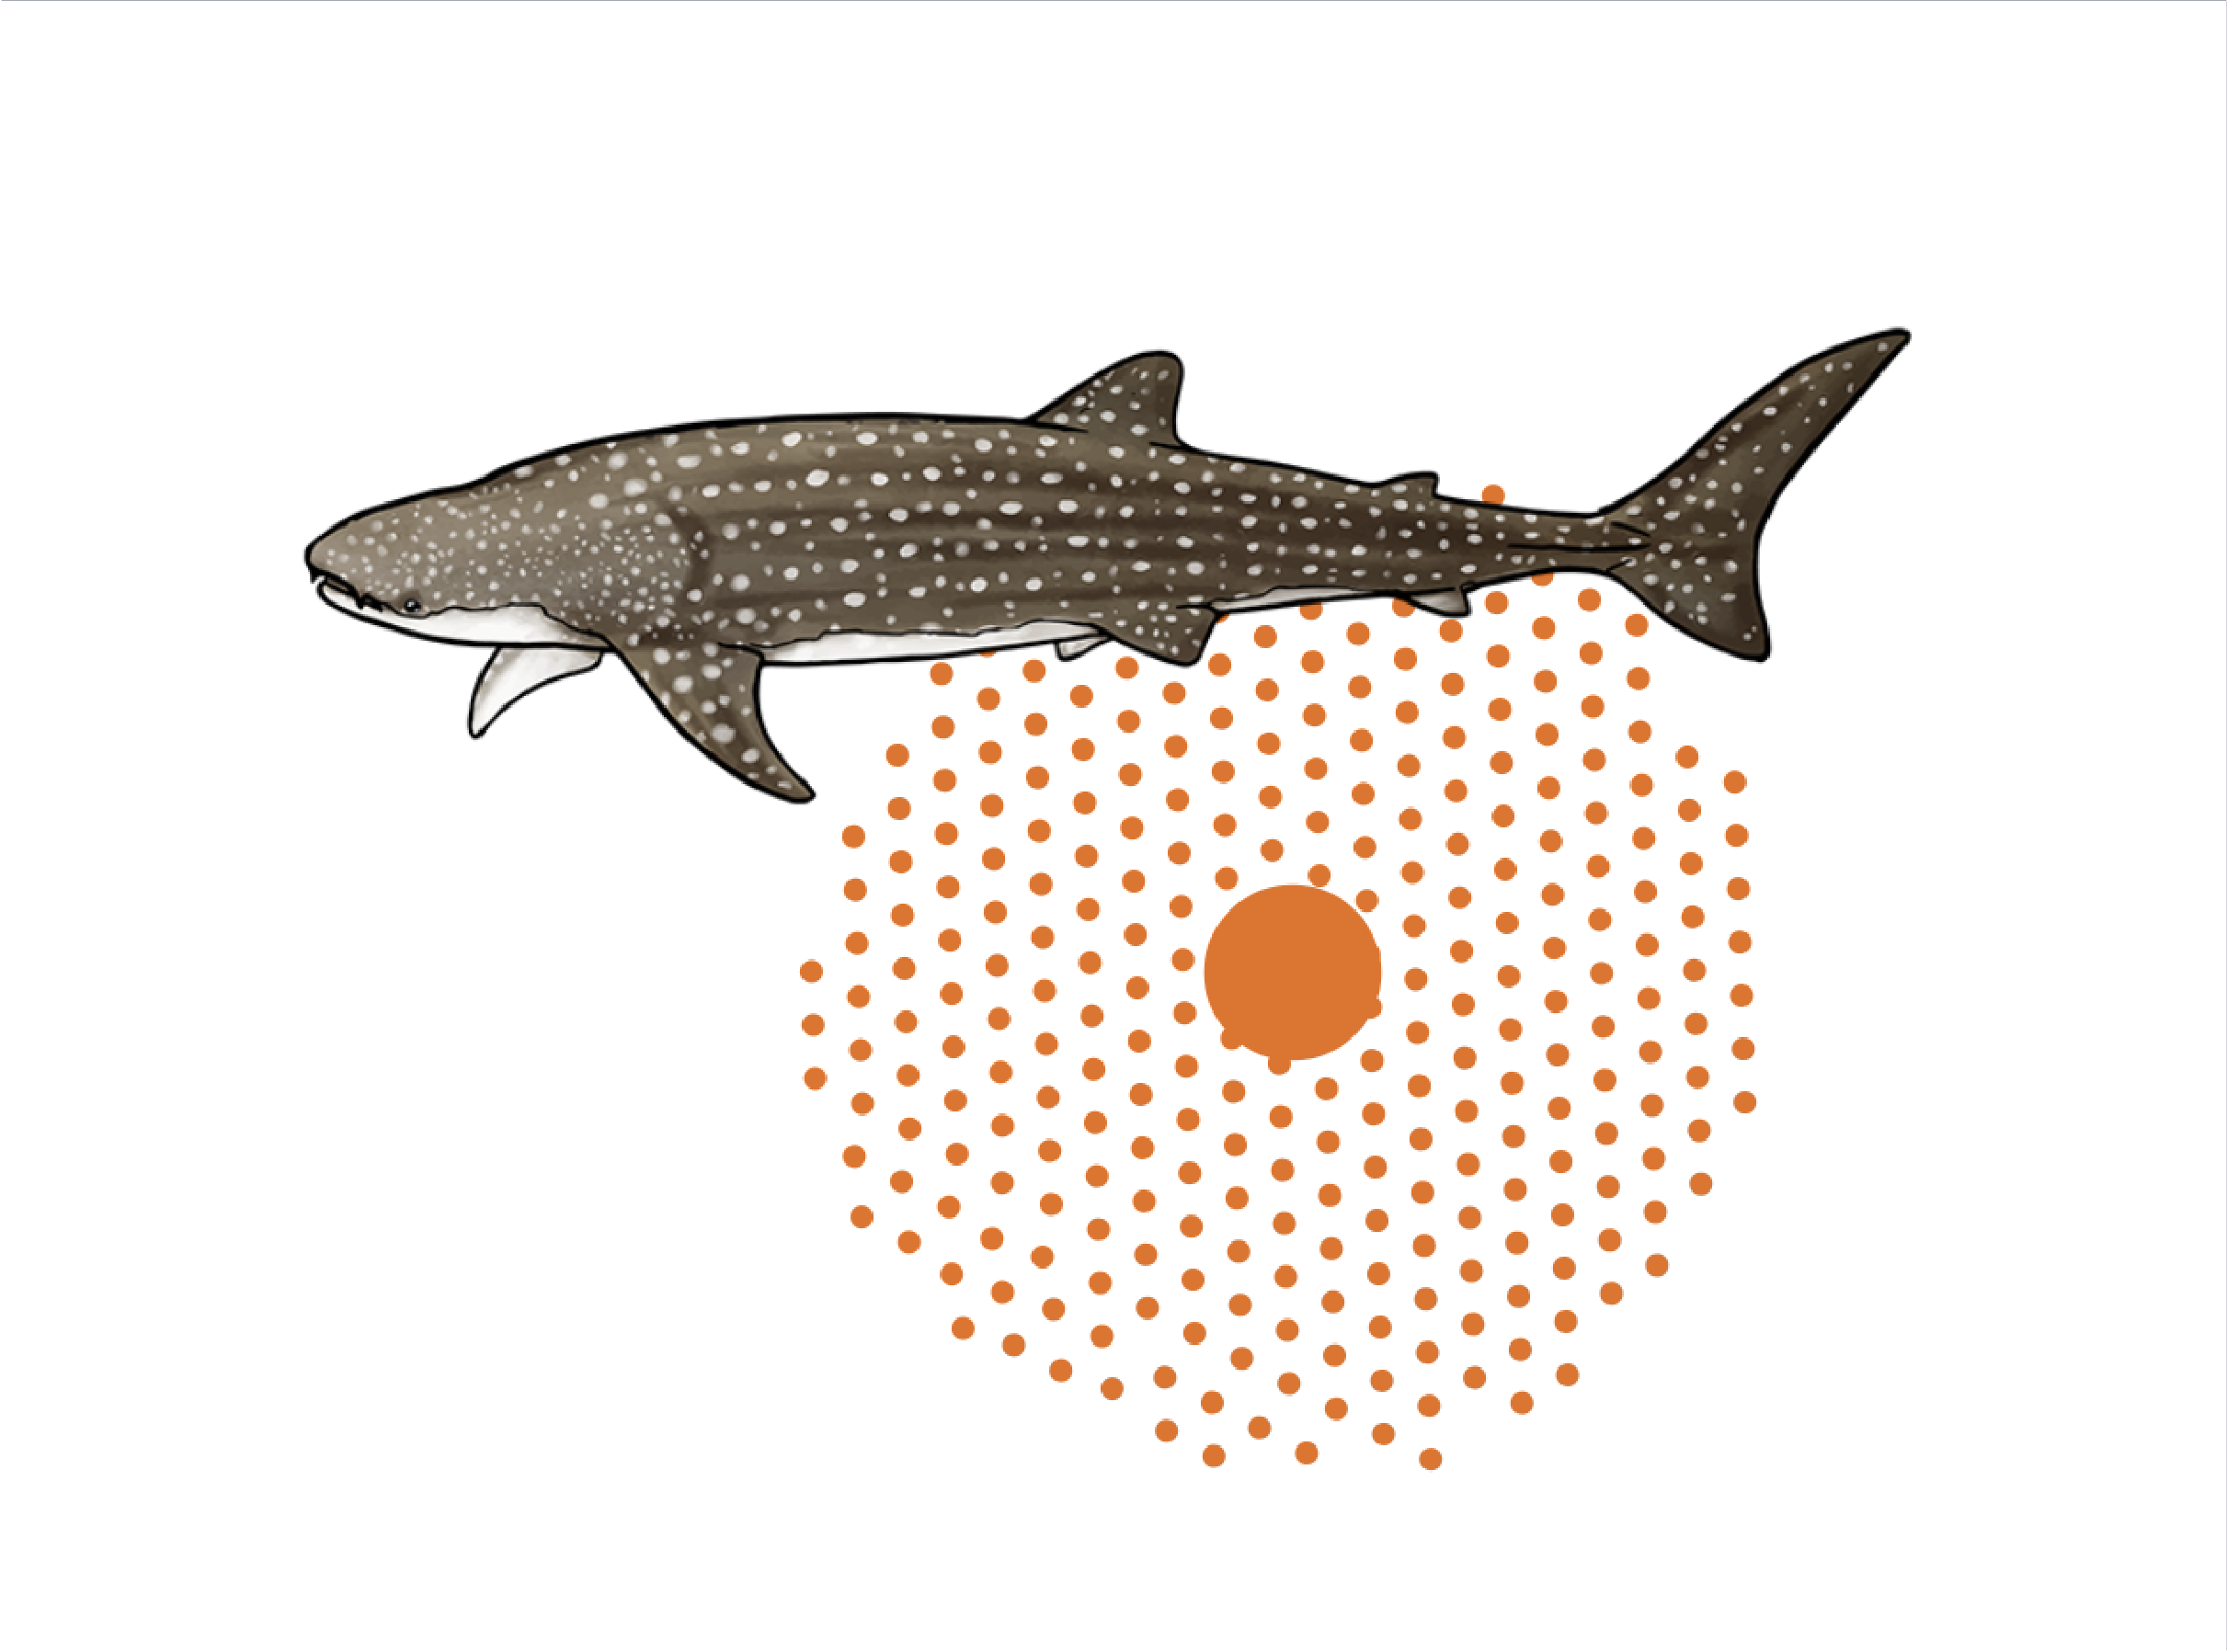
Visualizing shark numberes
Interactive Storytelling
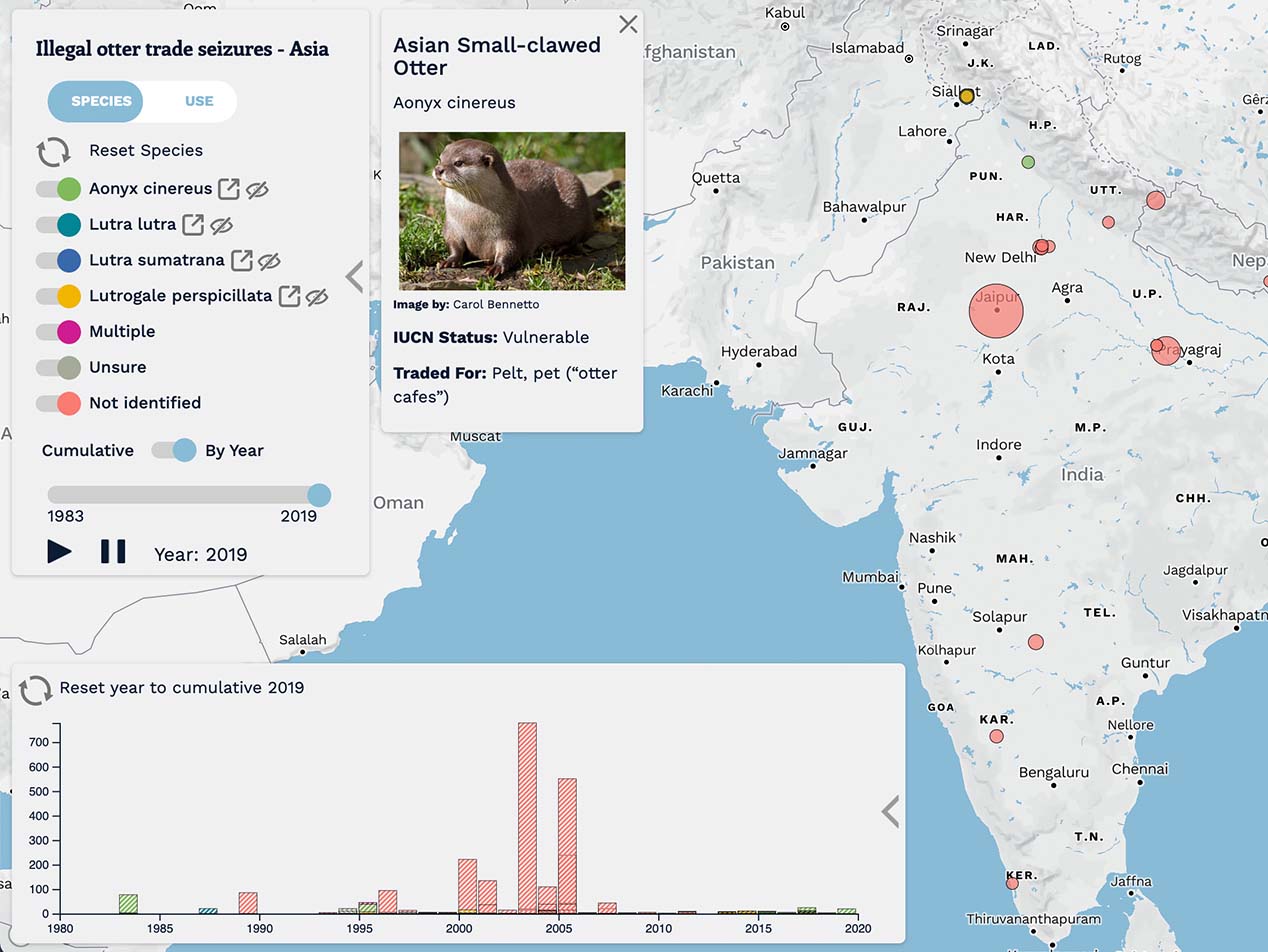
Illegal otter trade seizures
Exploratory tool, Interactive map / dataviz
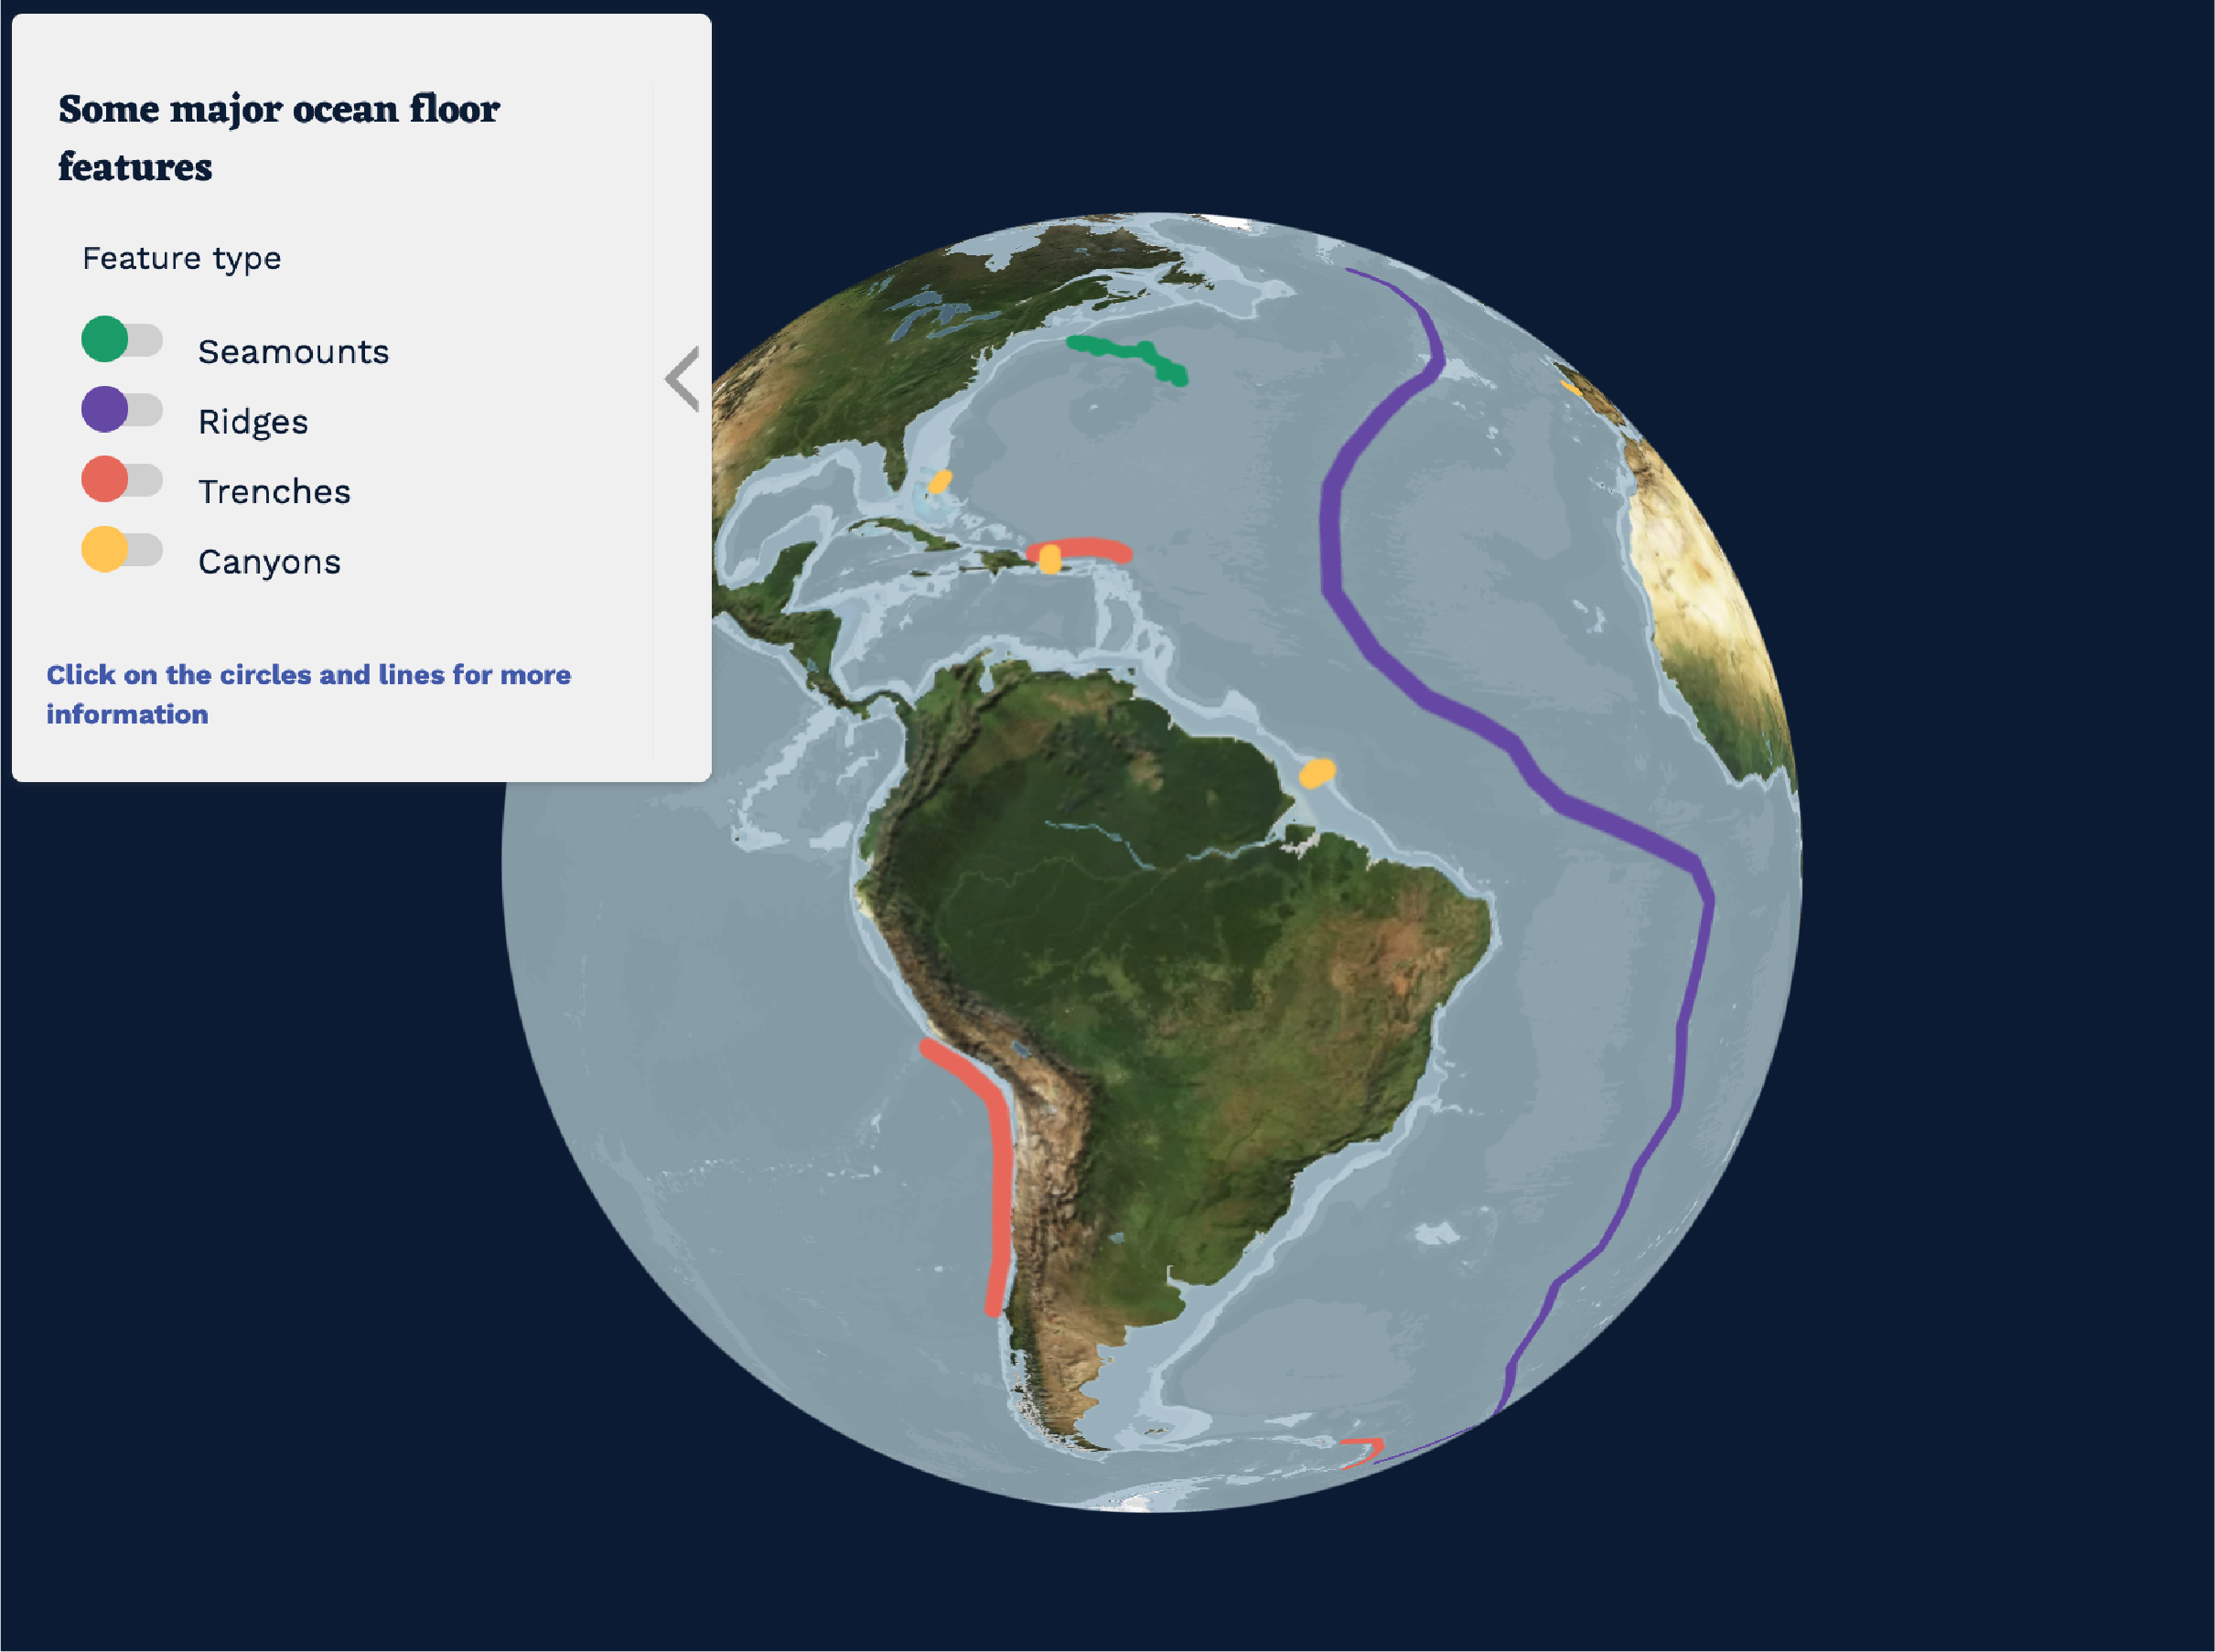
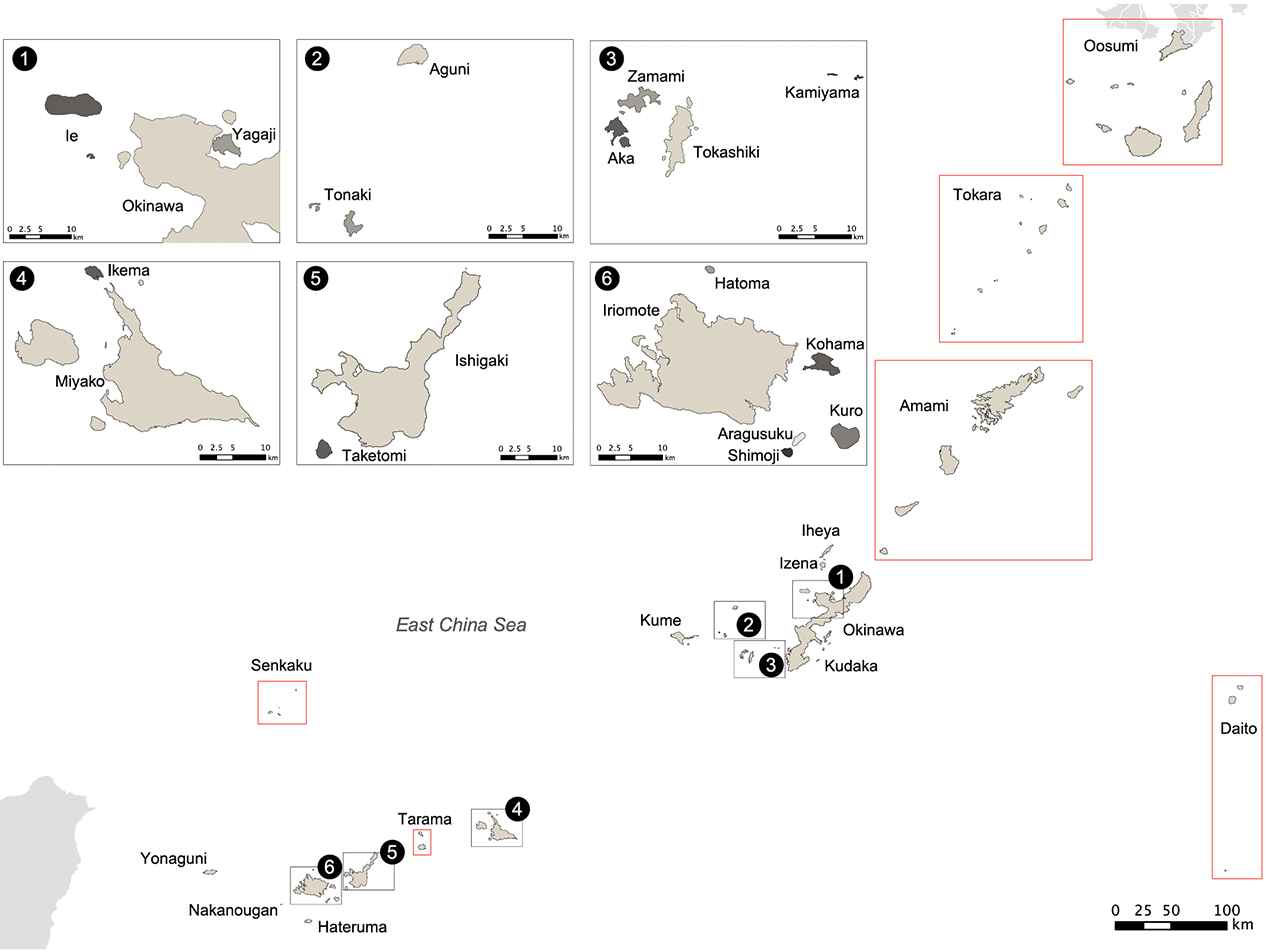
Mapping the wonders of the underwater world
Exploratory tool, Interactive map
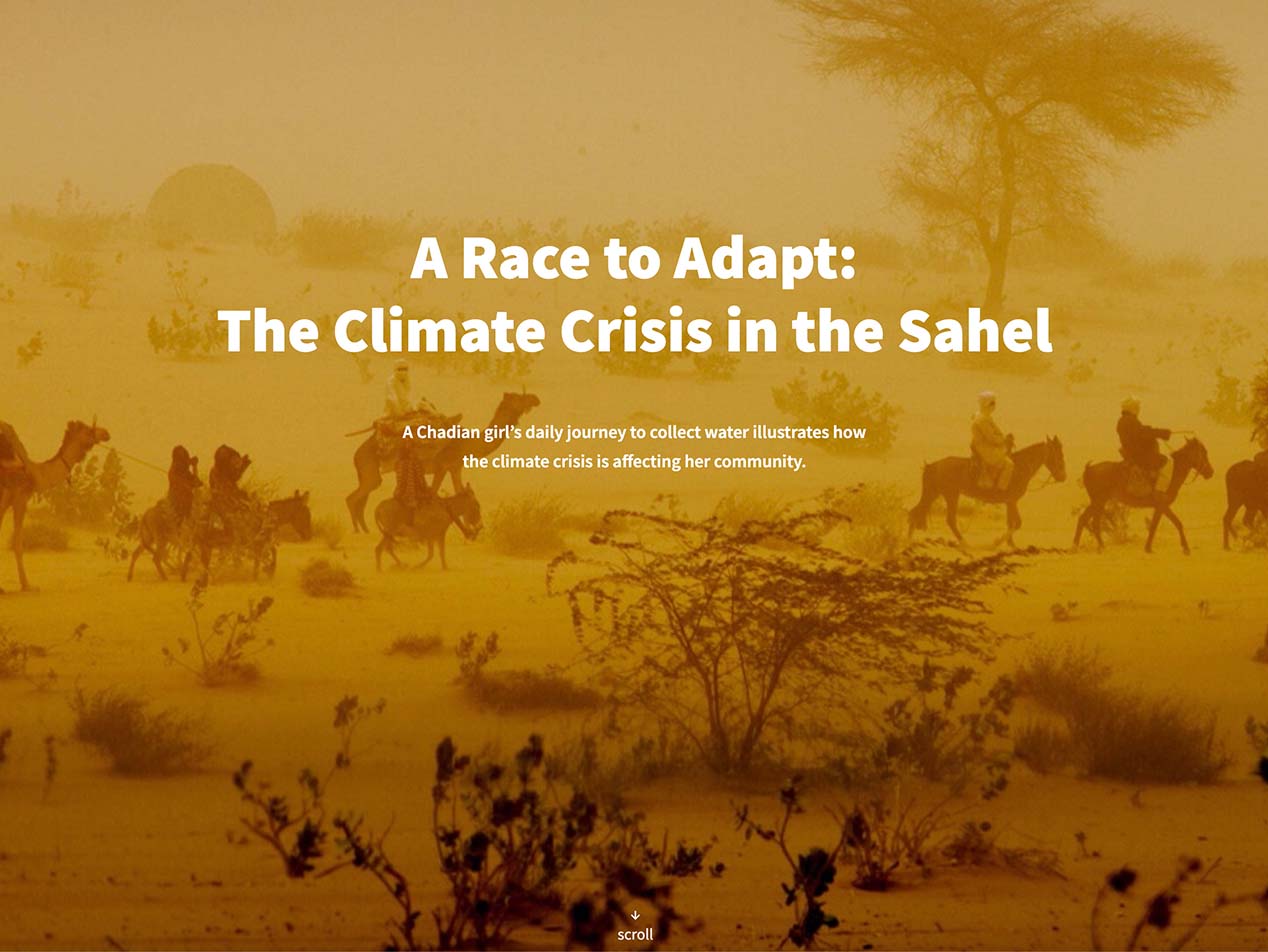
The Climate Crisis in the Sahel
Data storytelling, Humanitarian
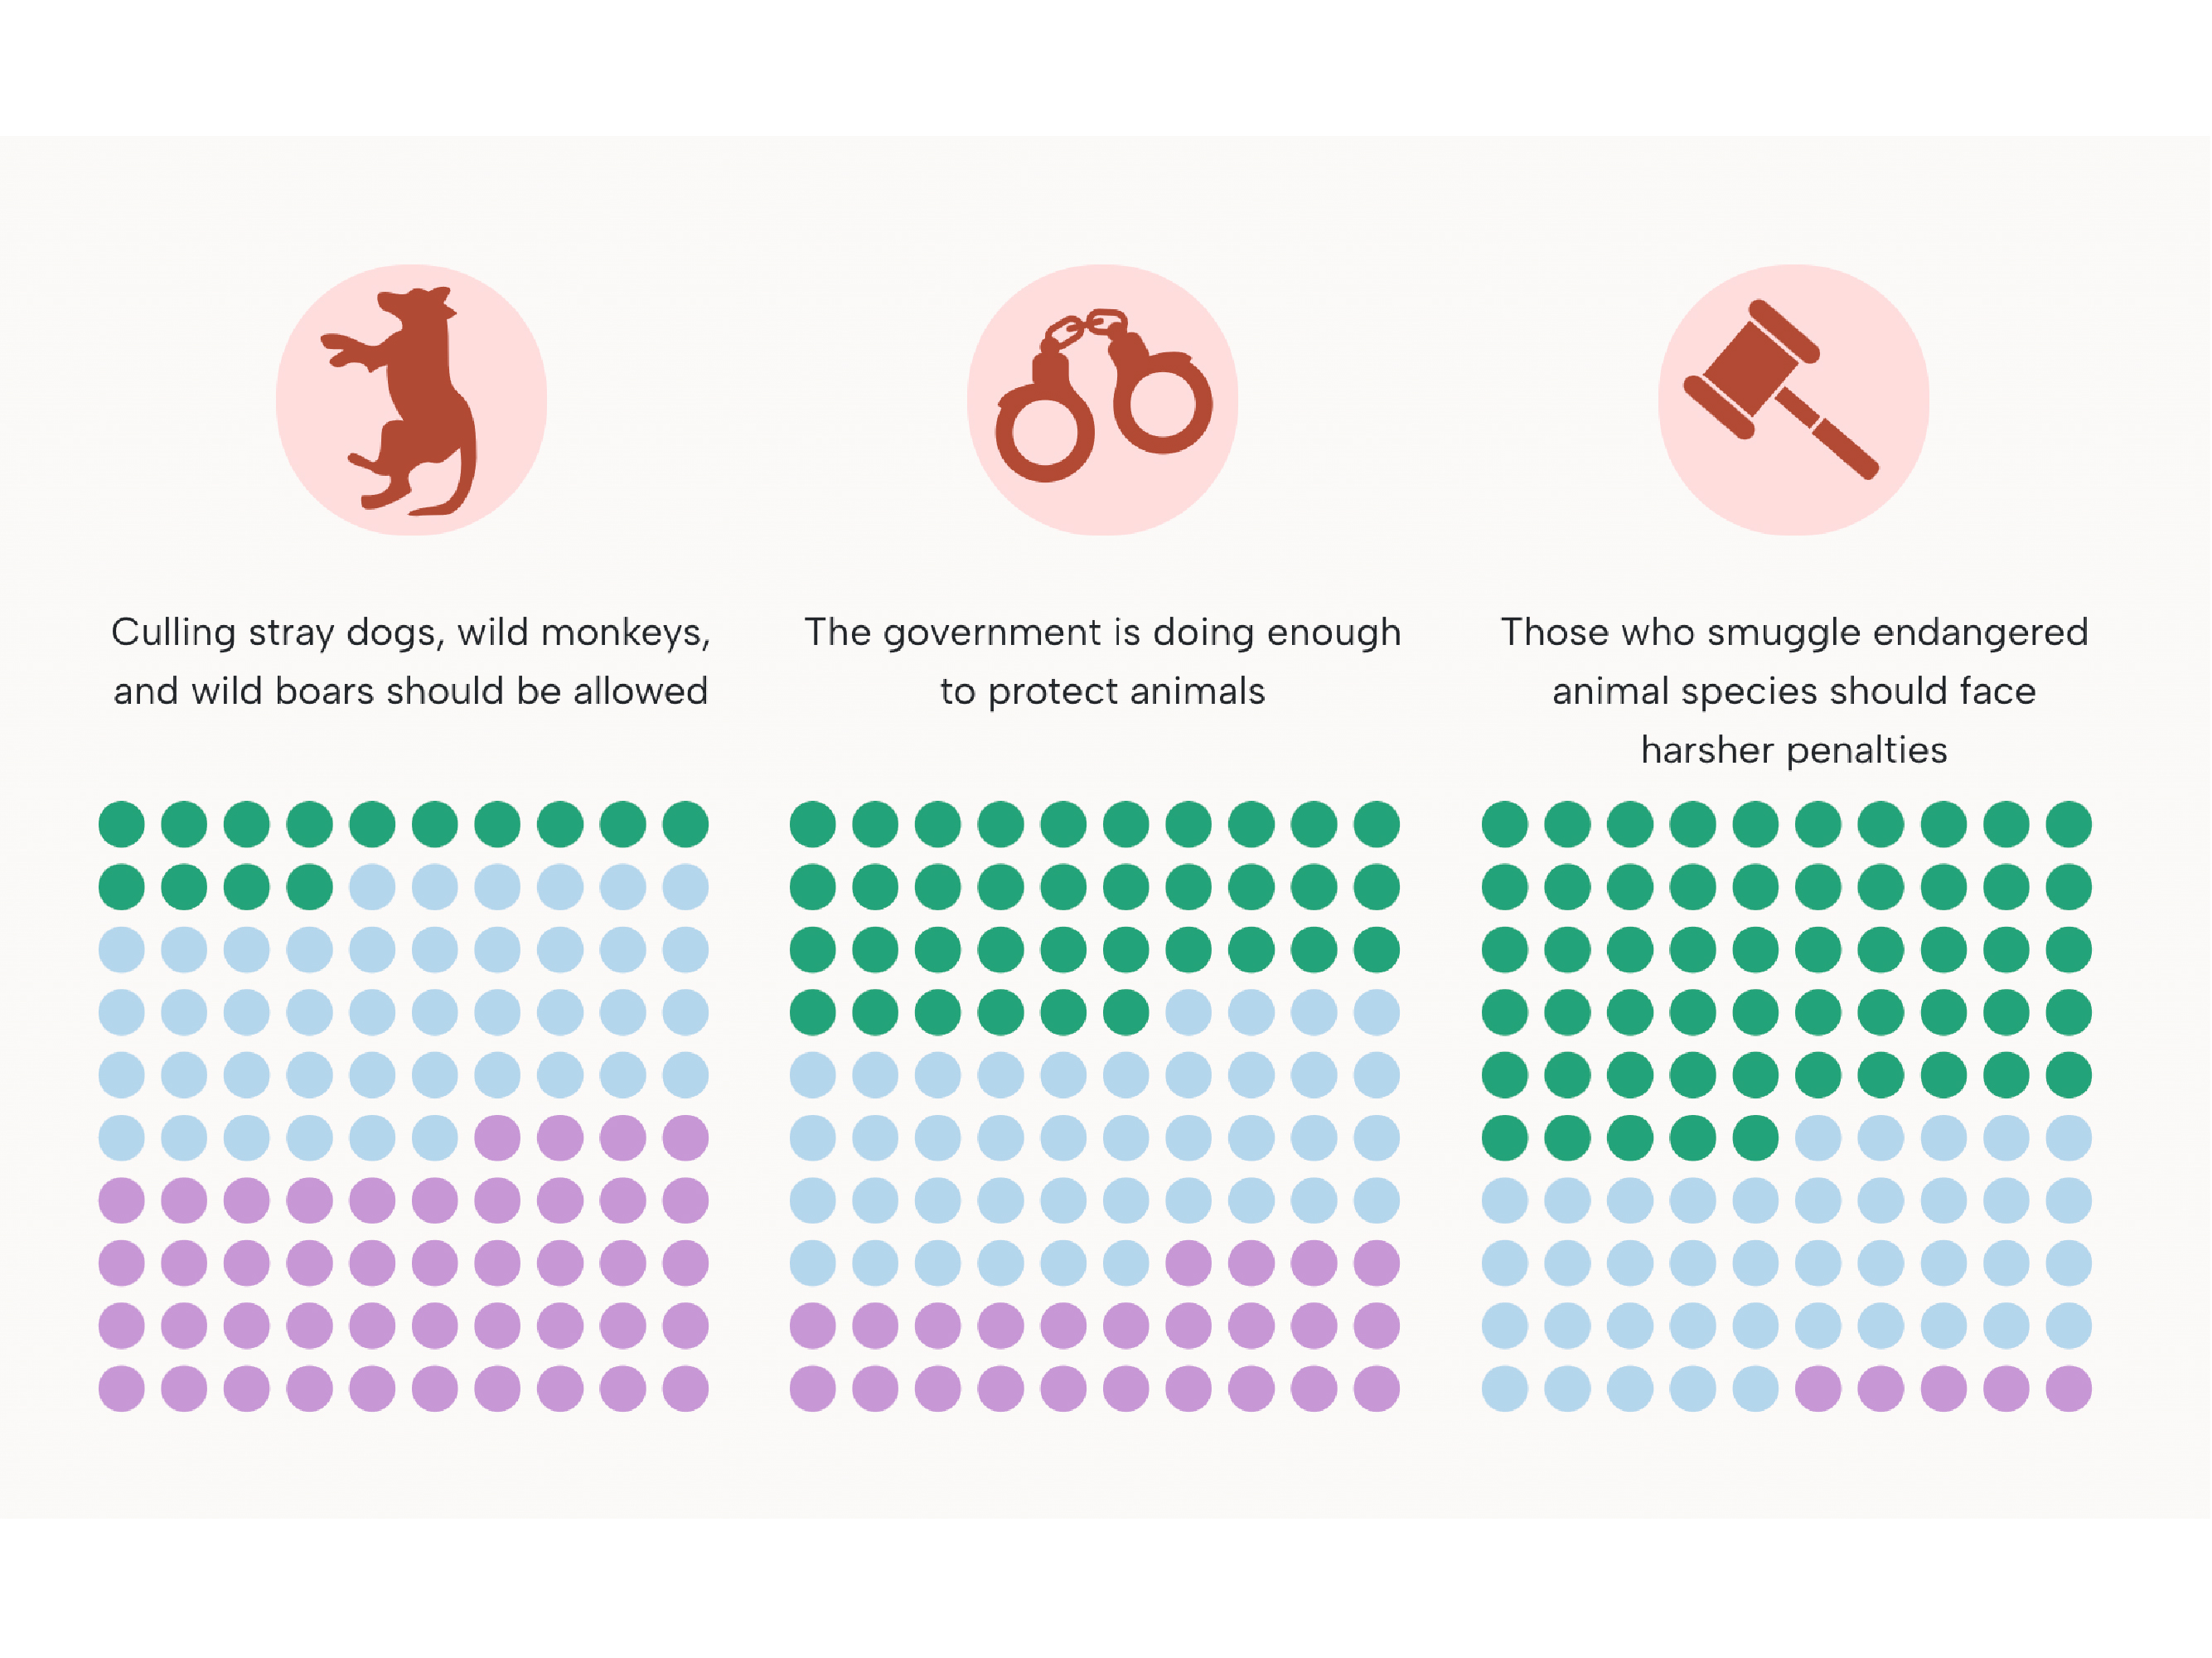
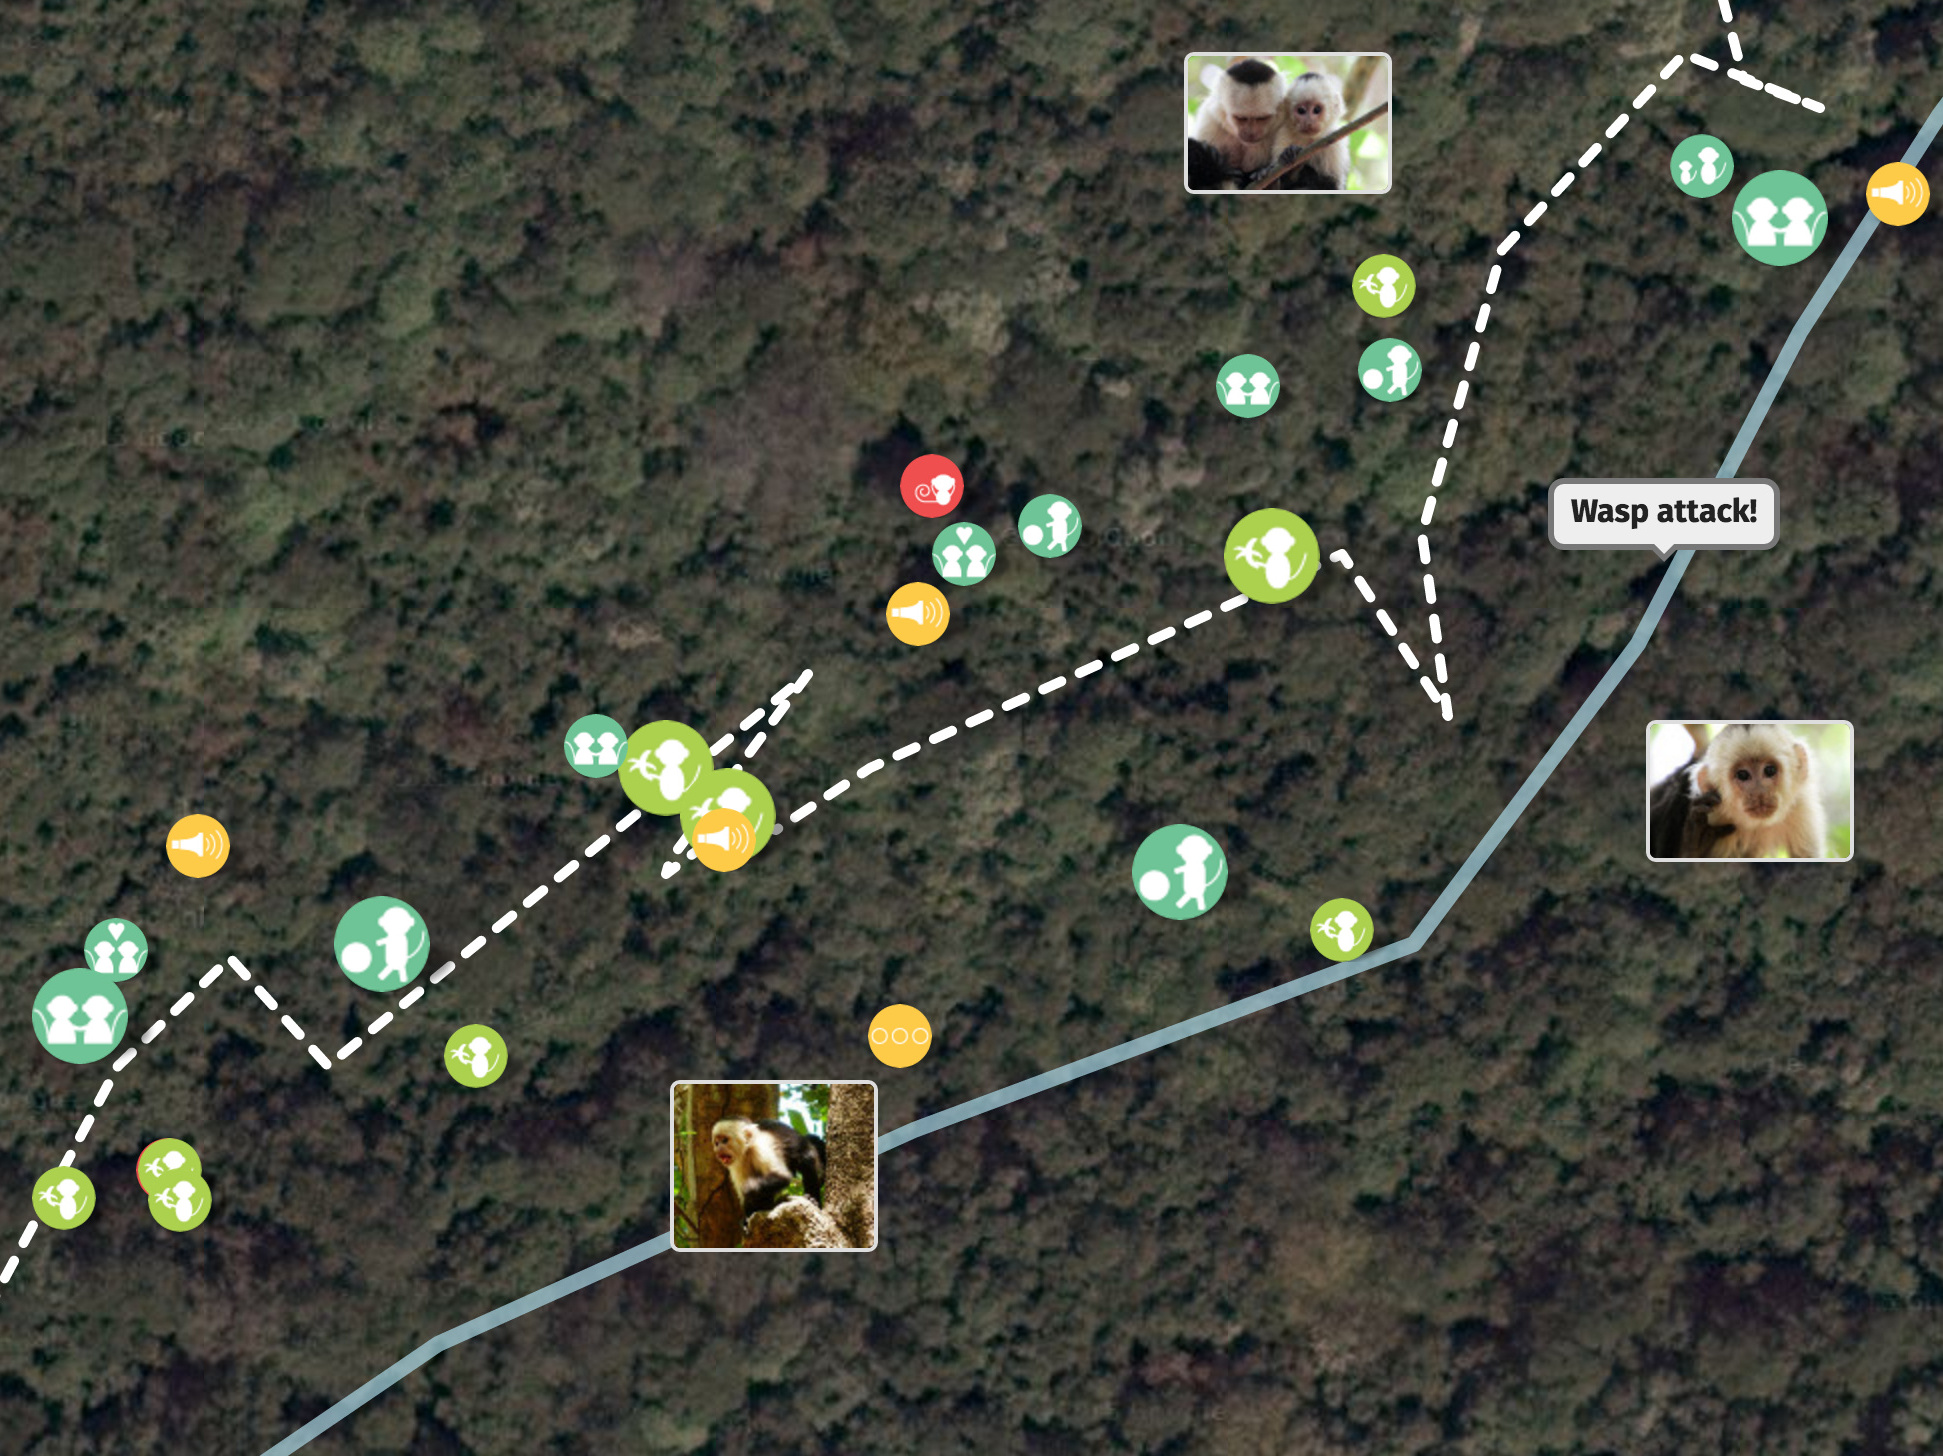
More than monkey business
Data journalism
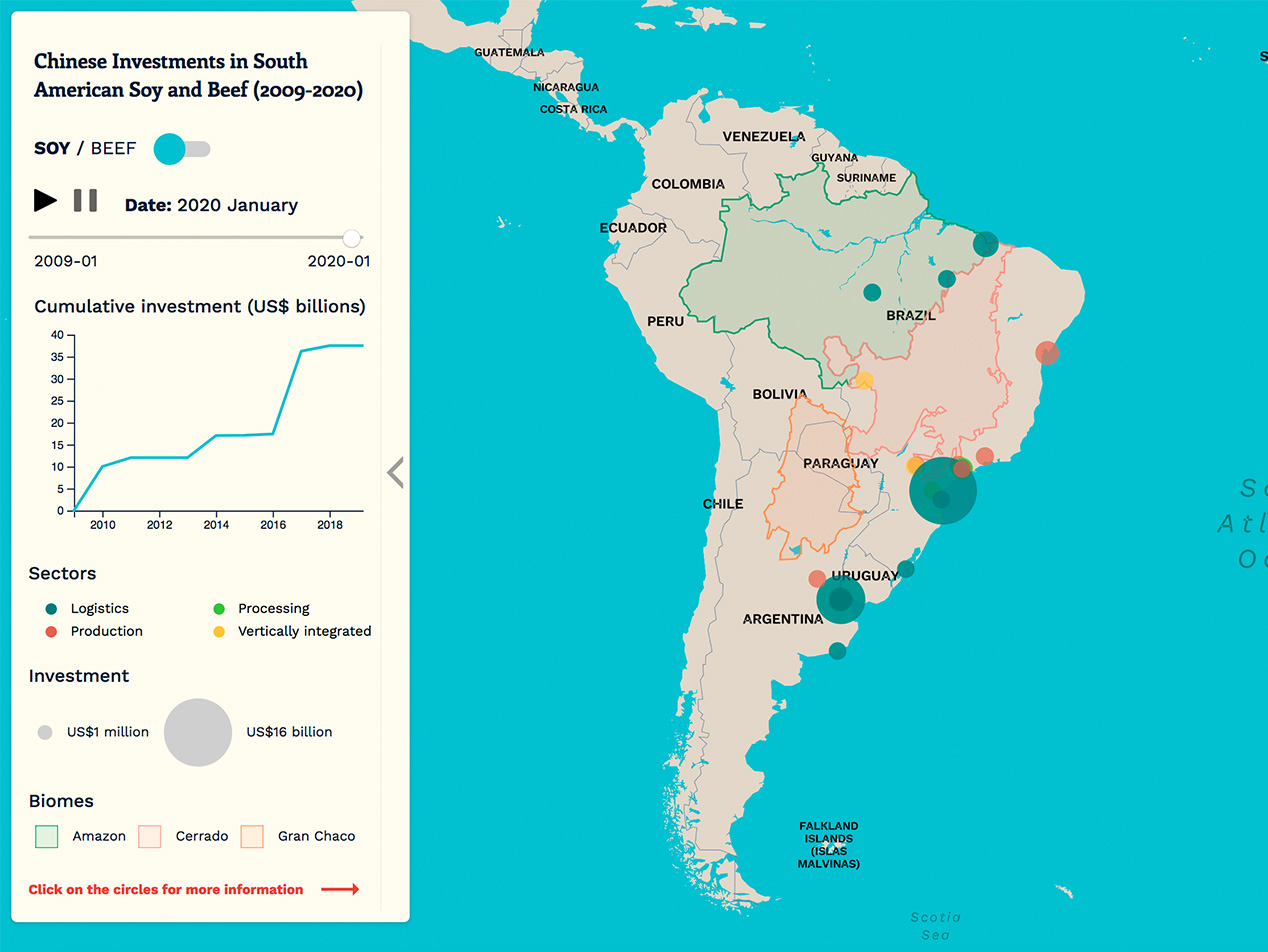
Interactive map: Chinese Investments in Soy / Beef
Exploratory tool, Interactive map
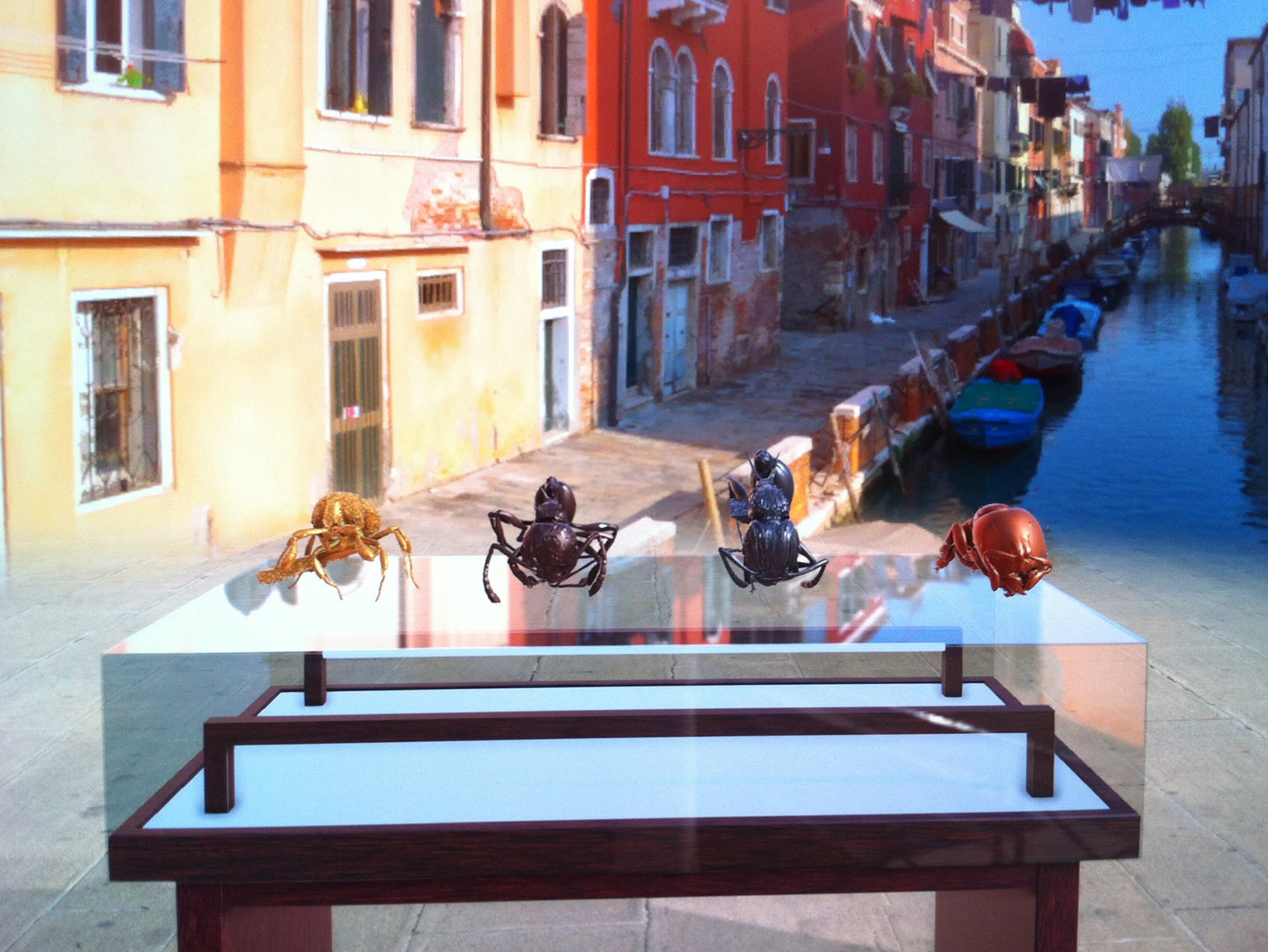
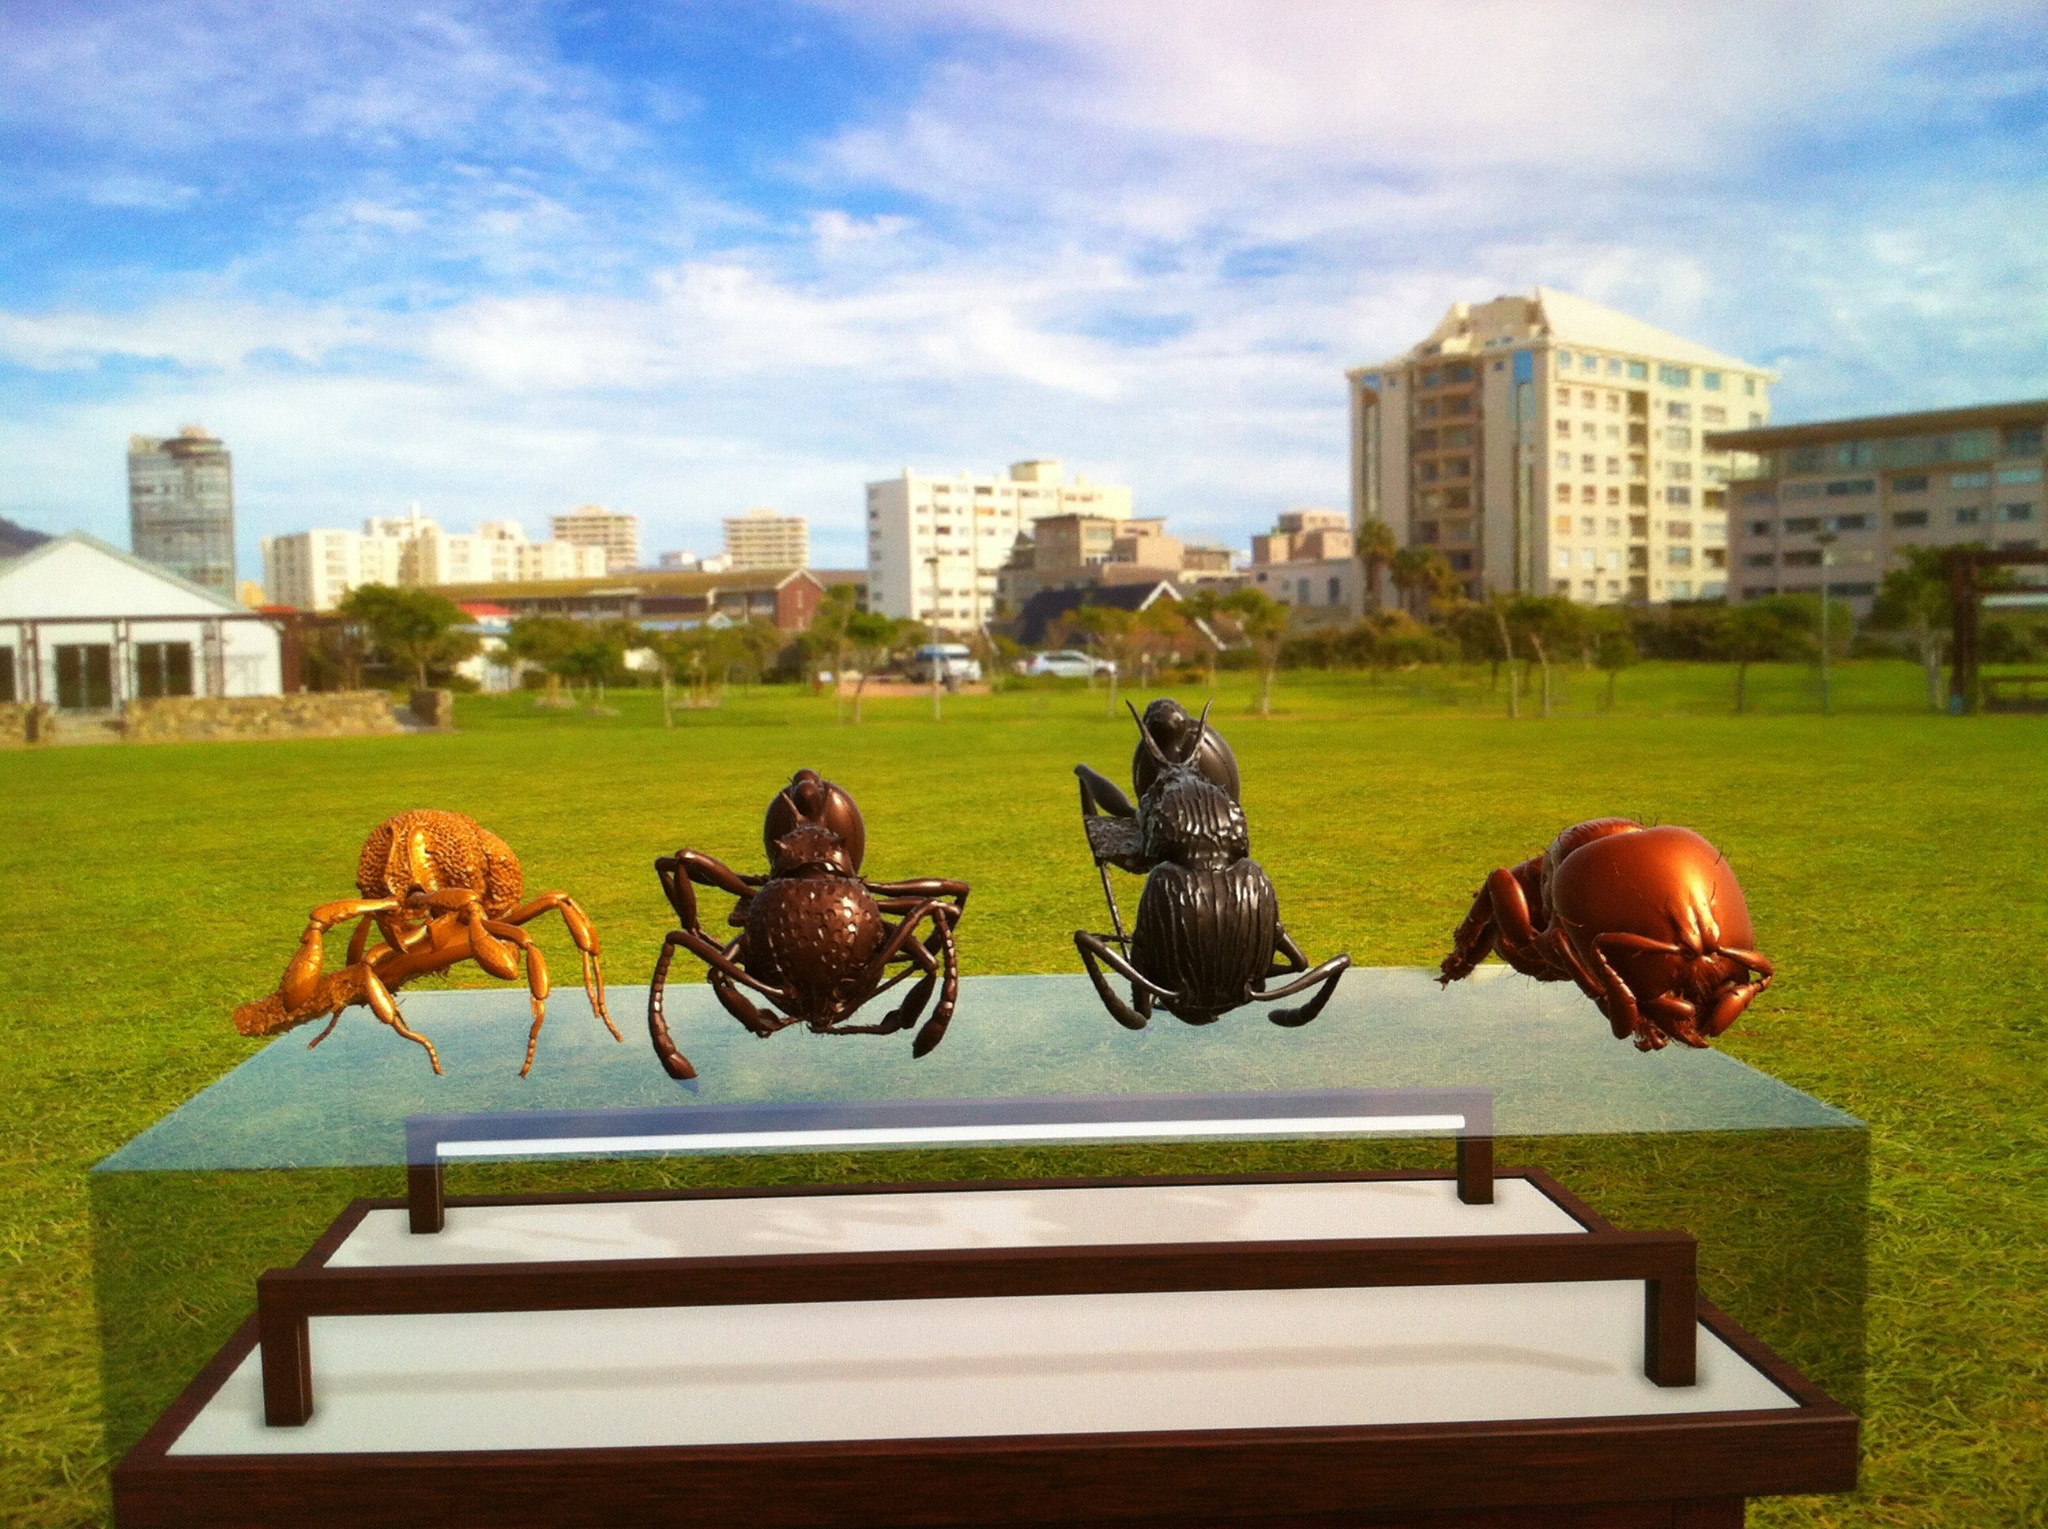
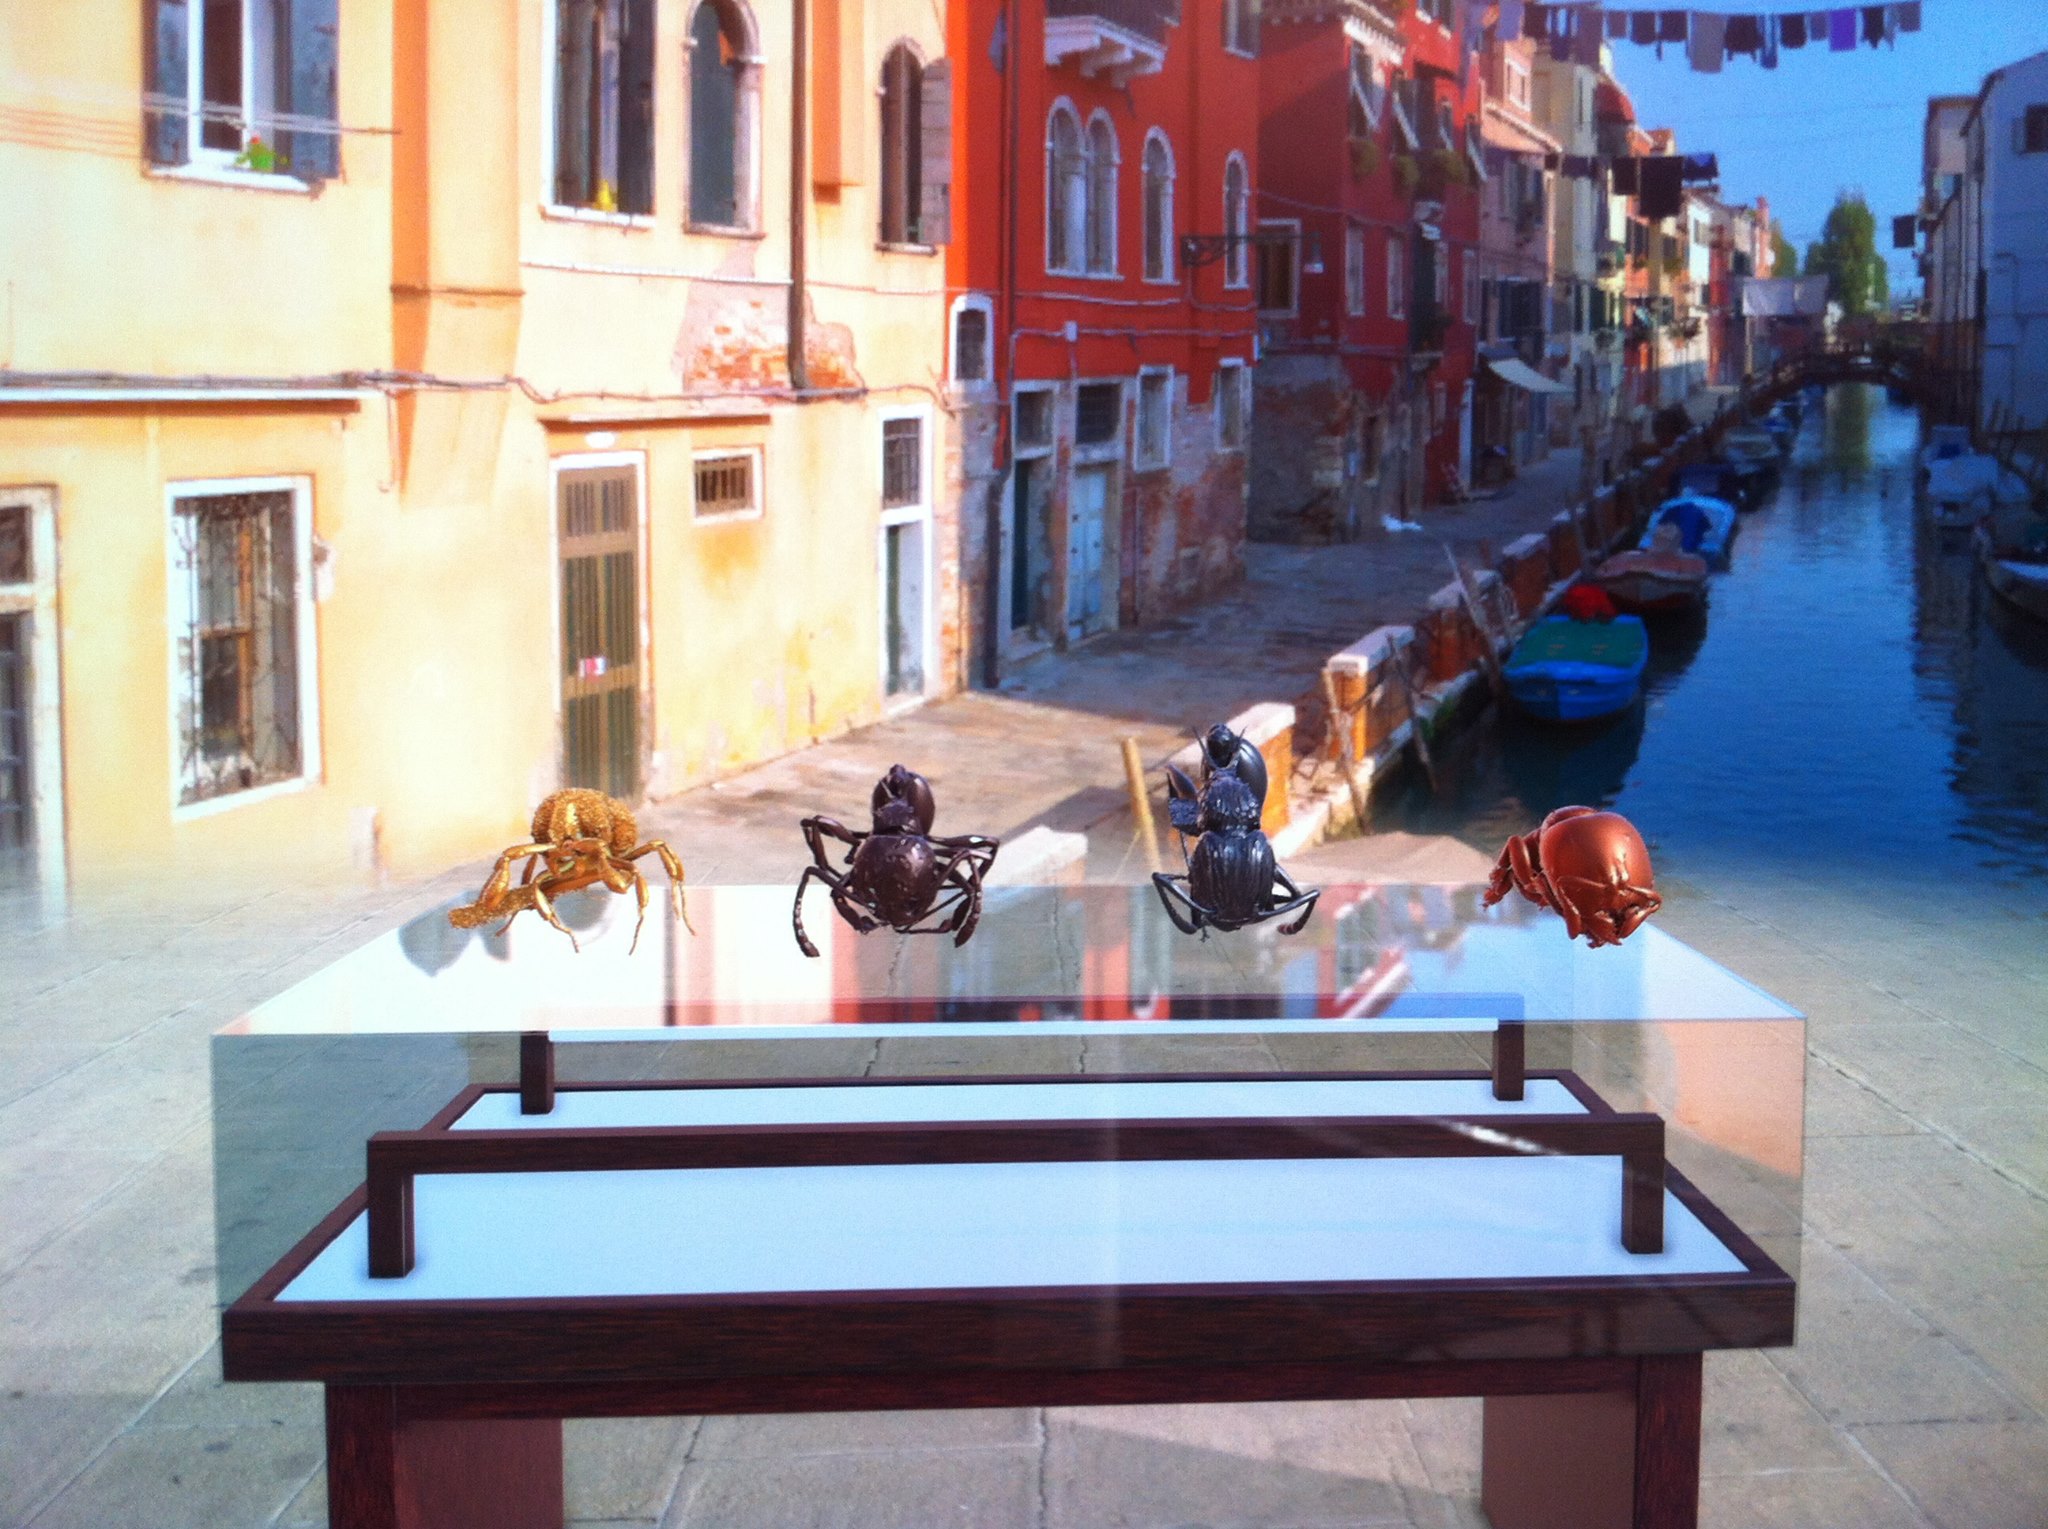
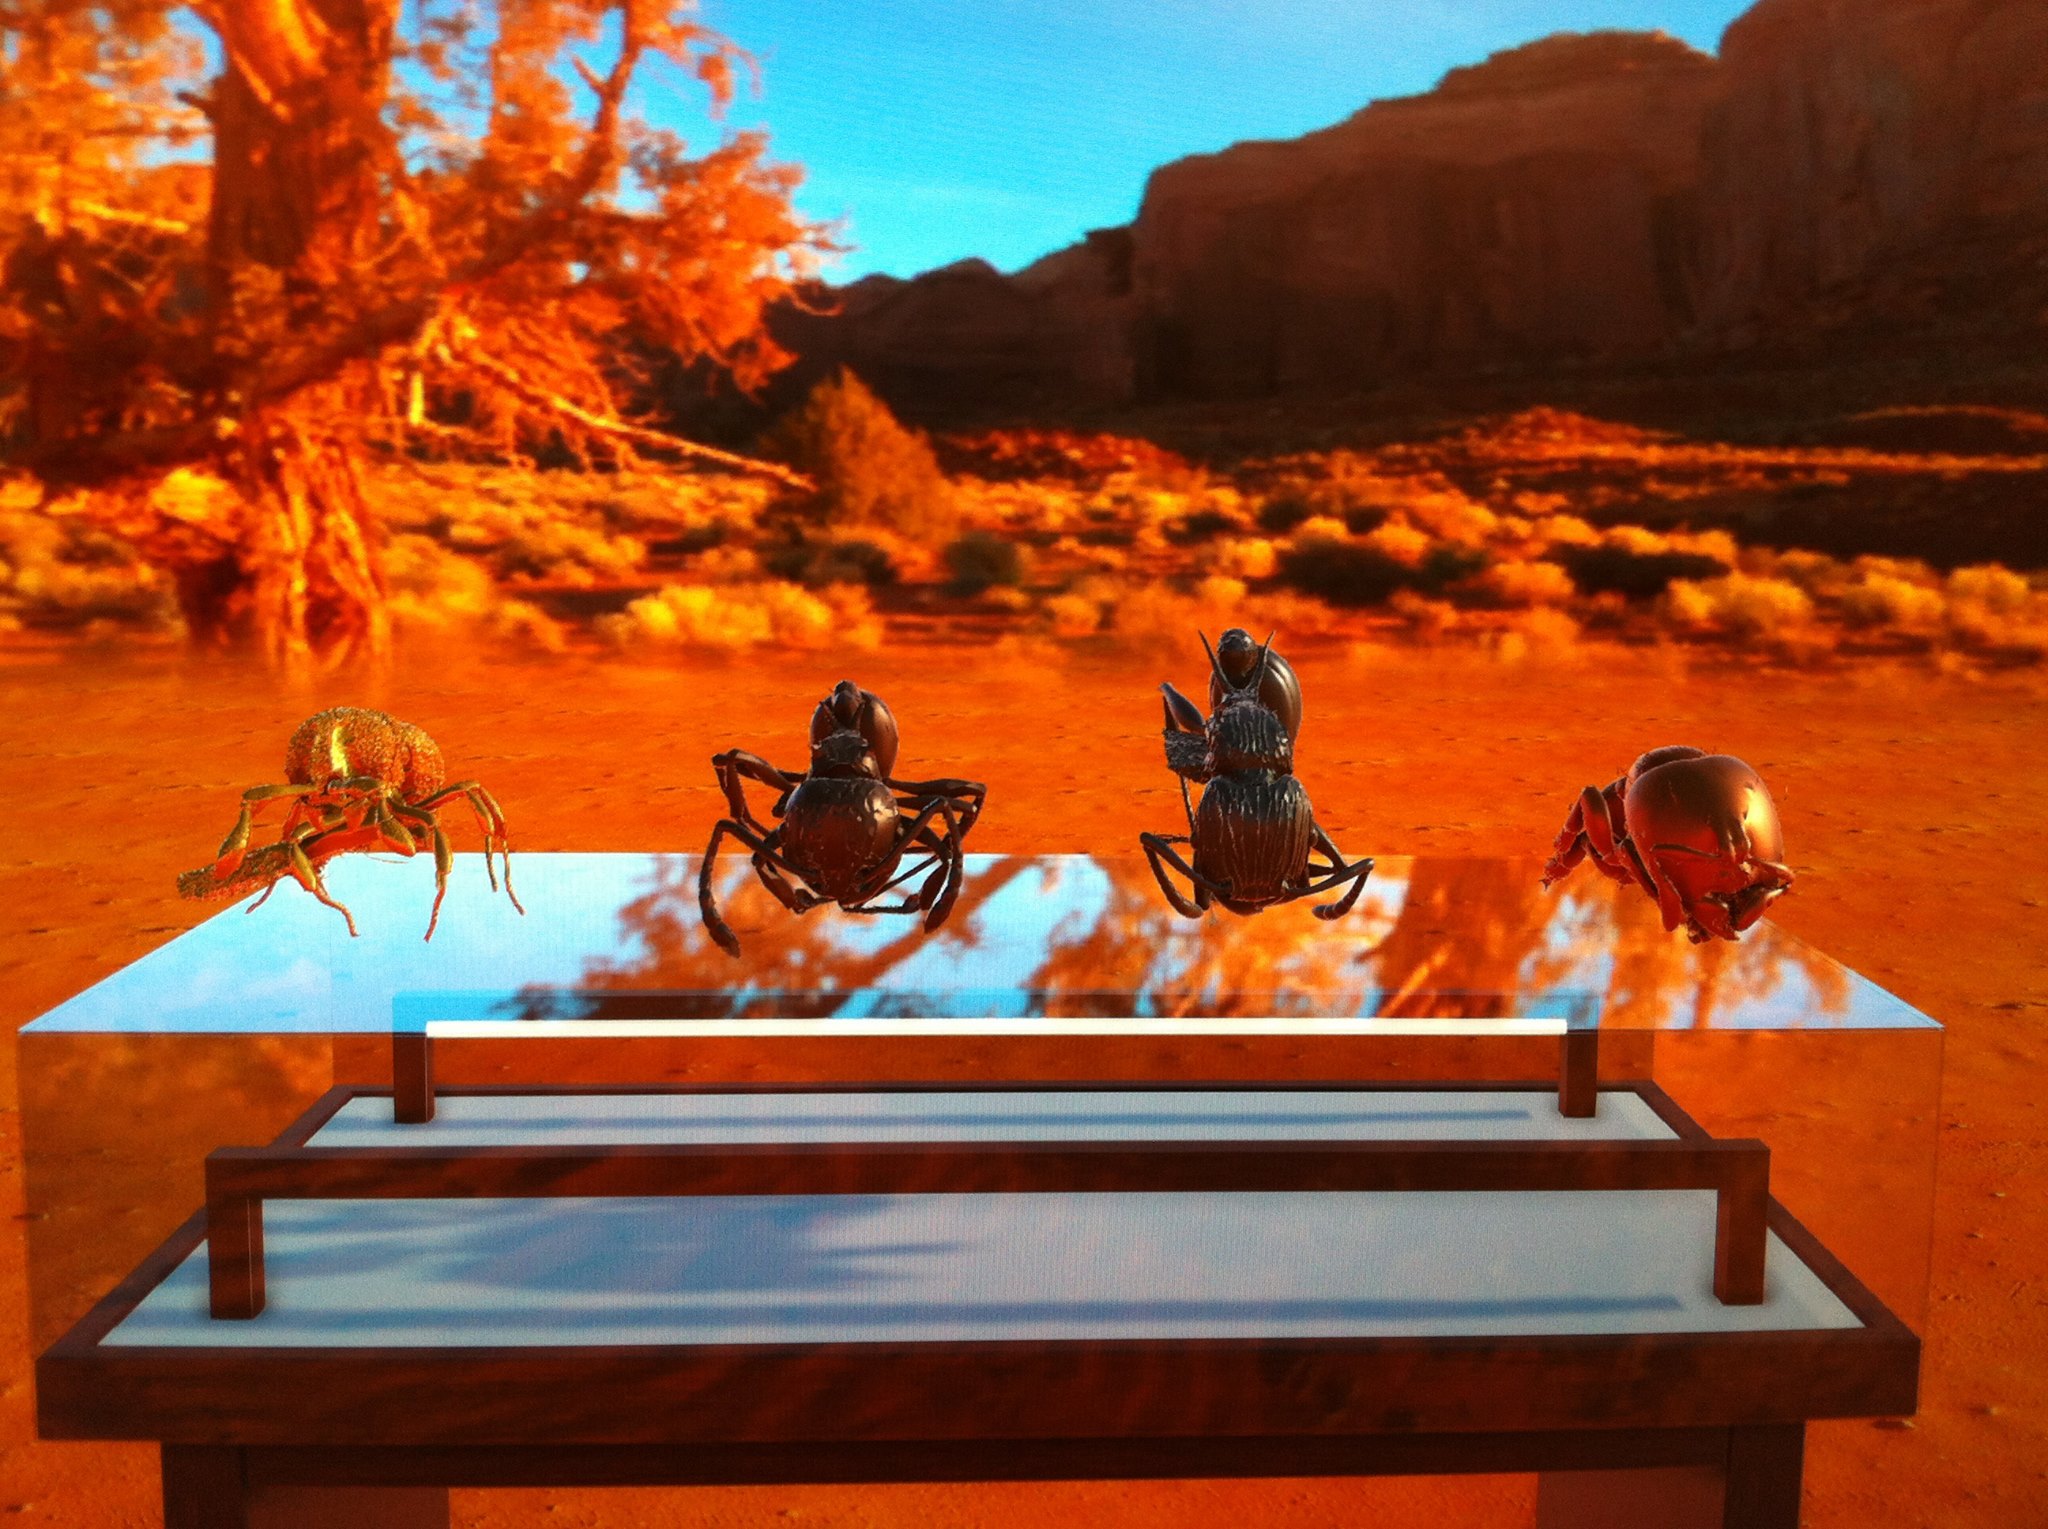
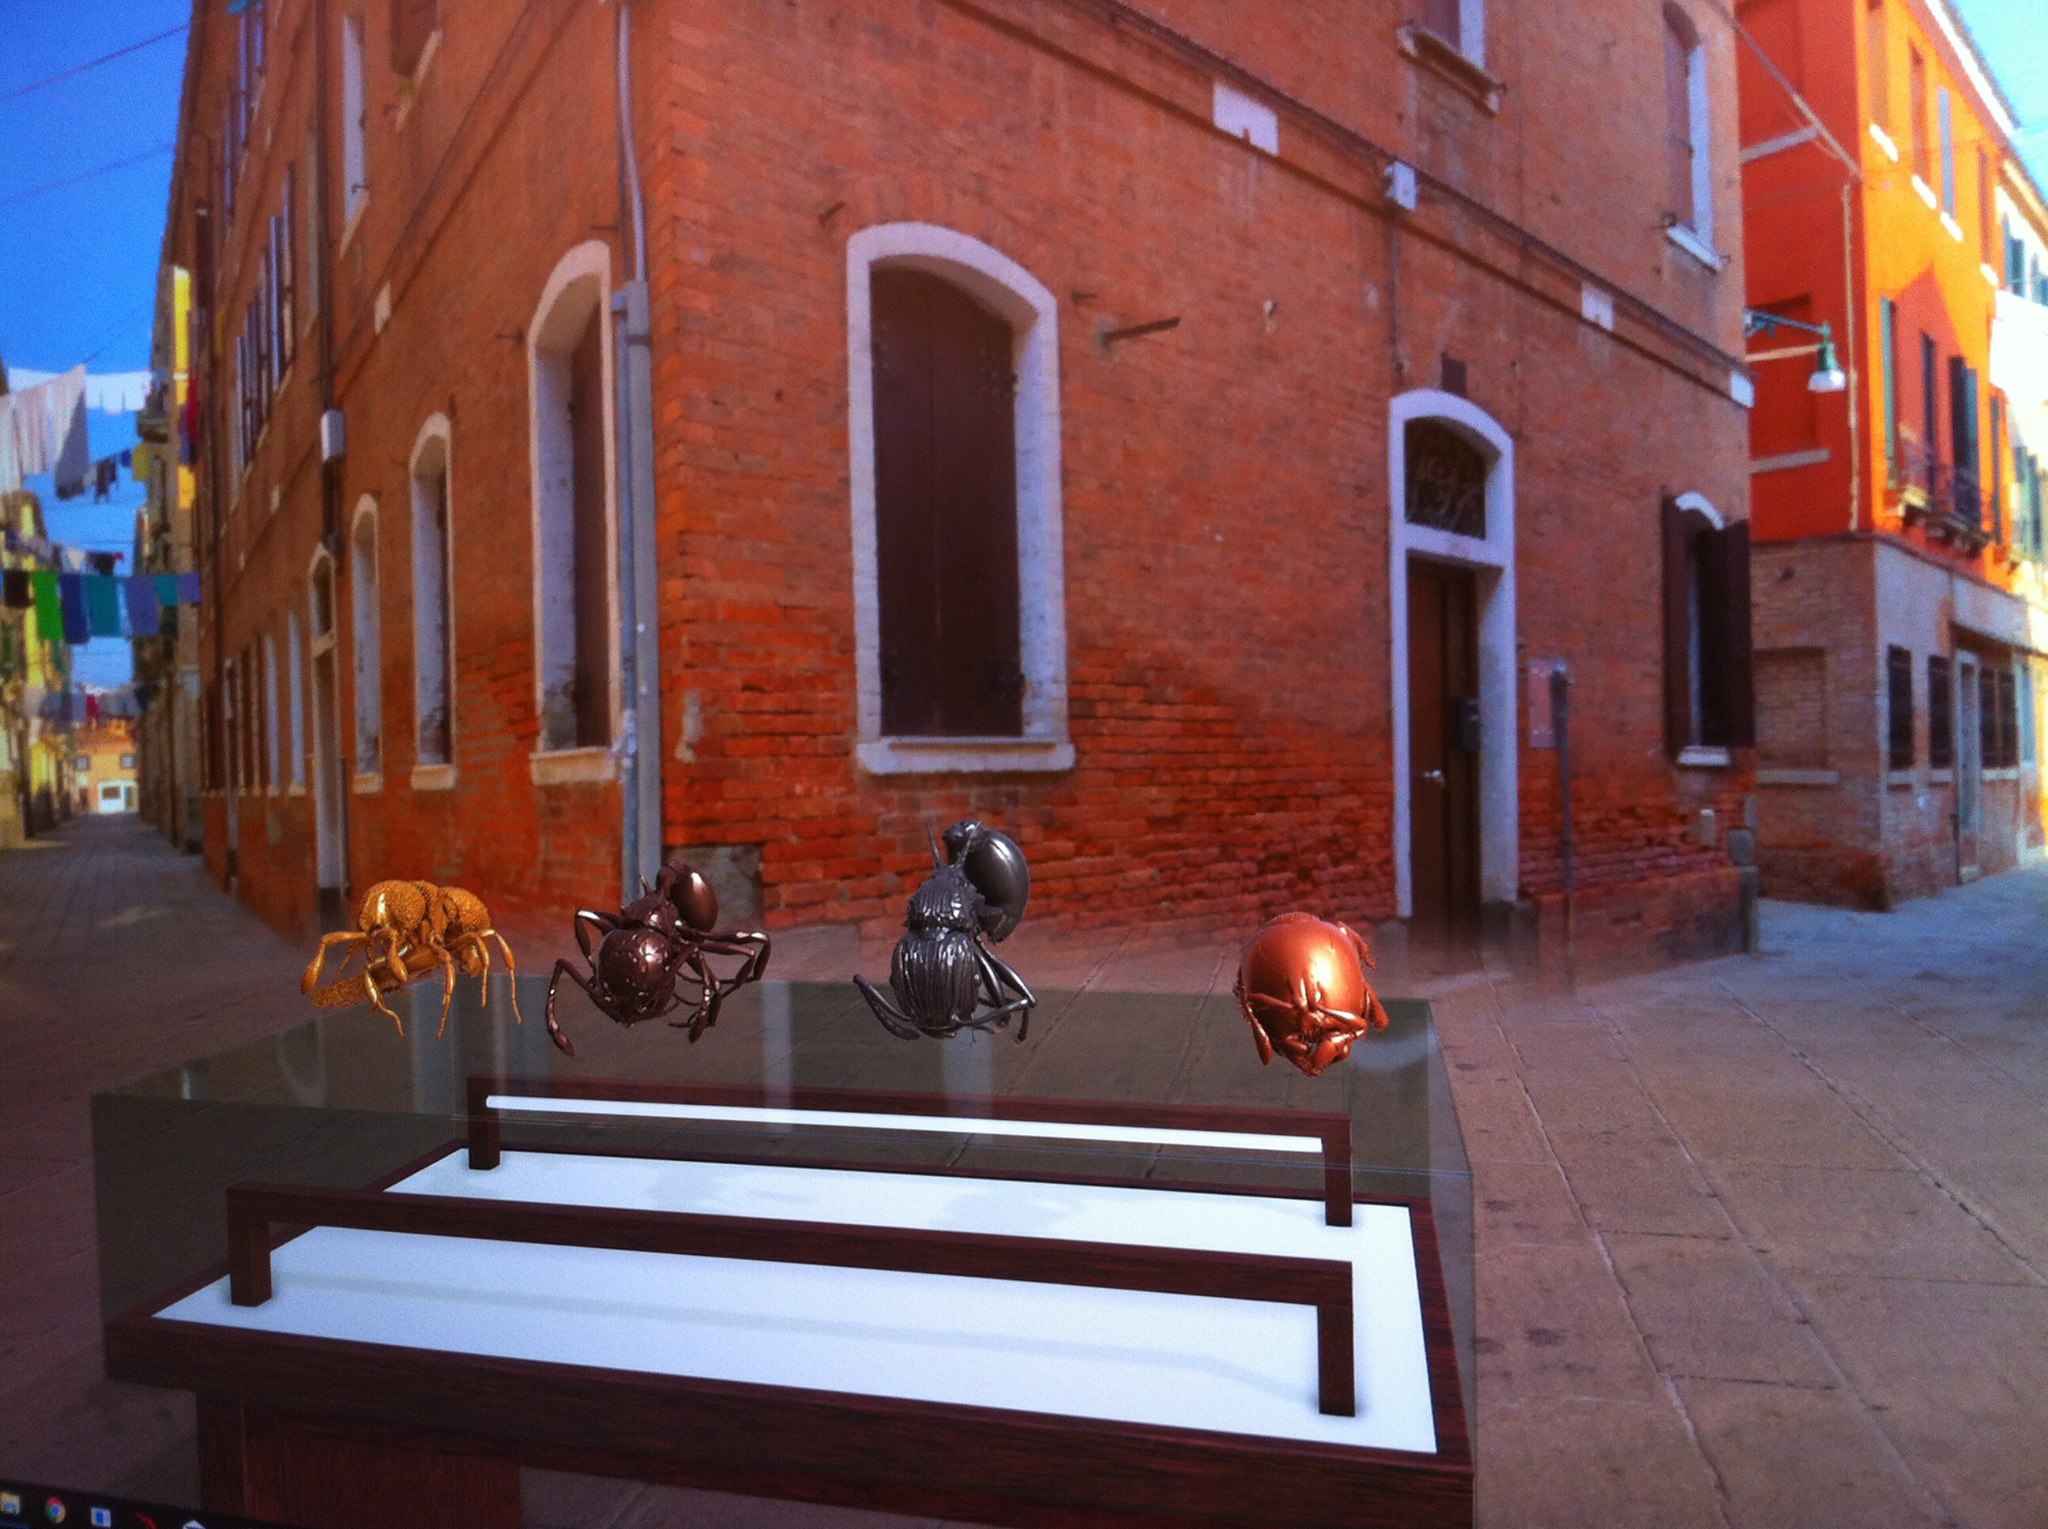
VR: Ant Museum
Virtual Reality, Education
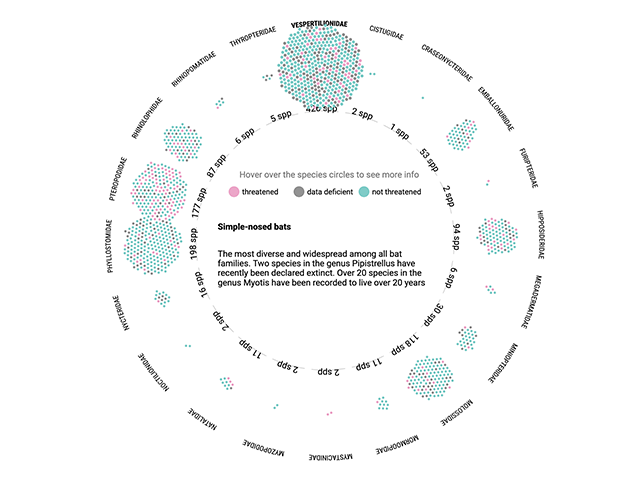
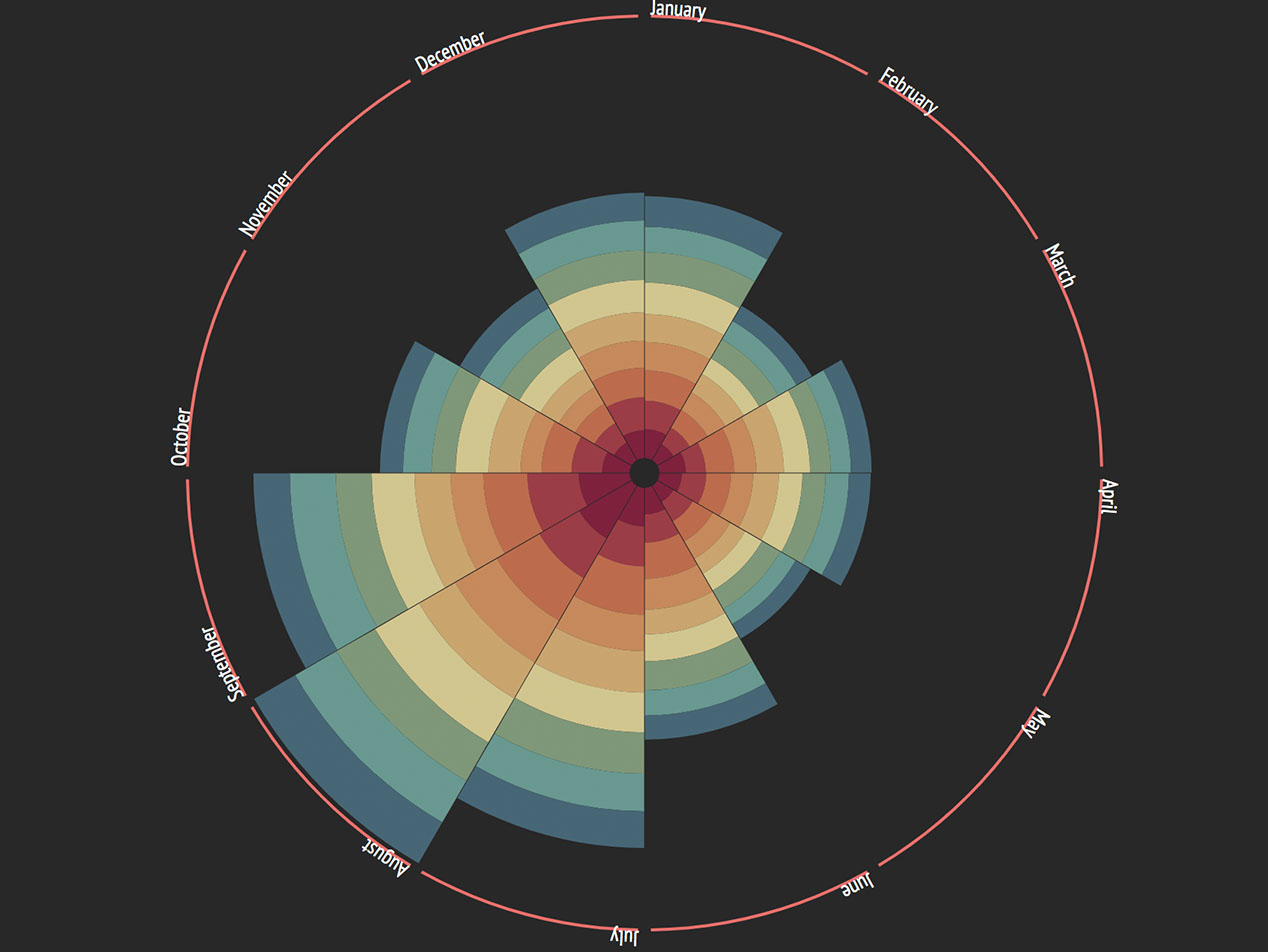
Interactive bat fact wheel
Data visualization
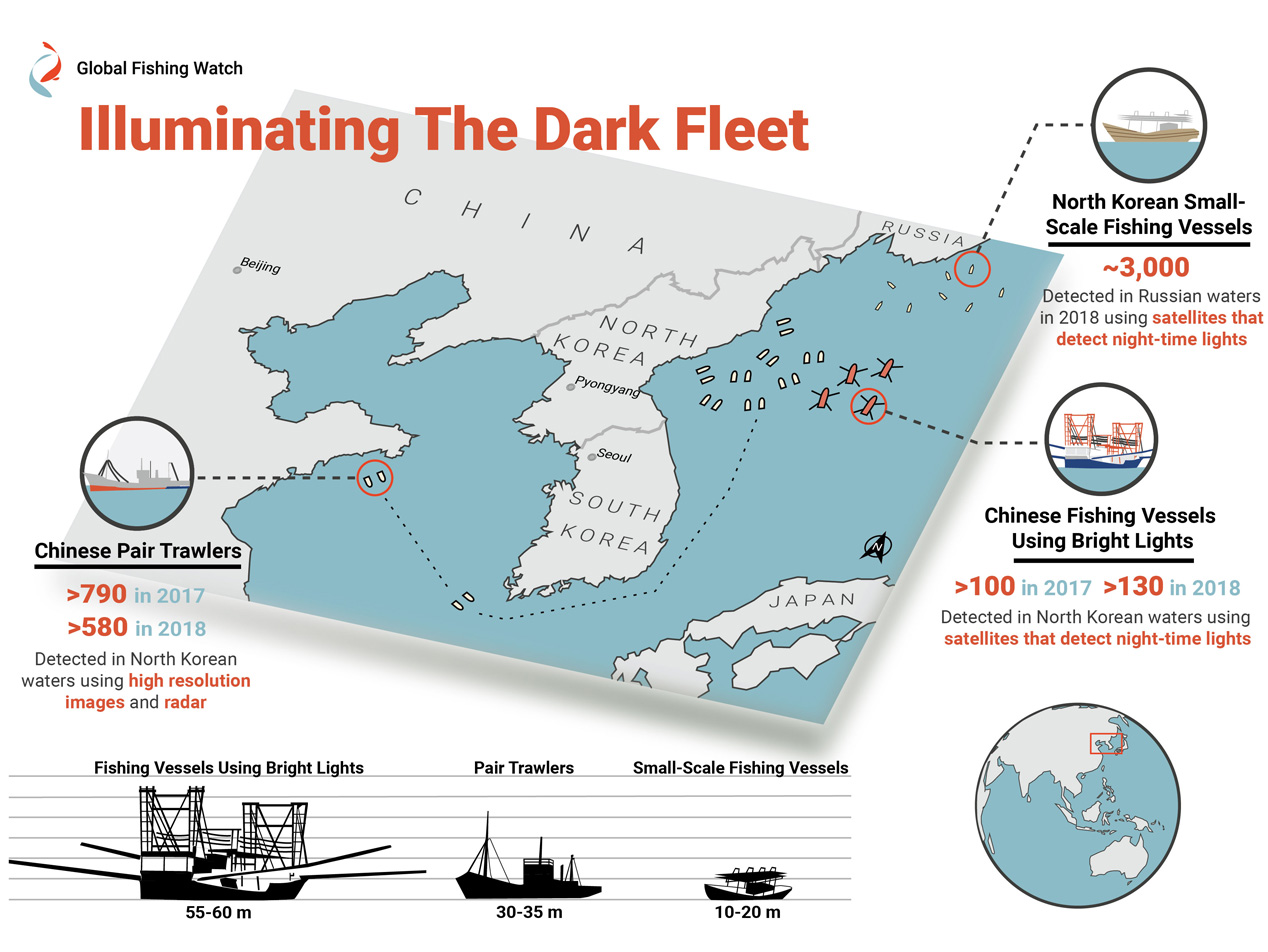
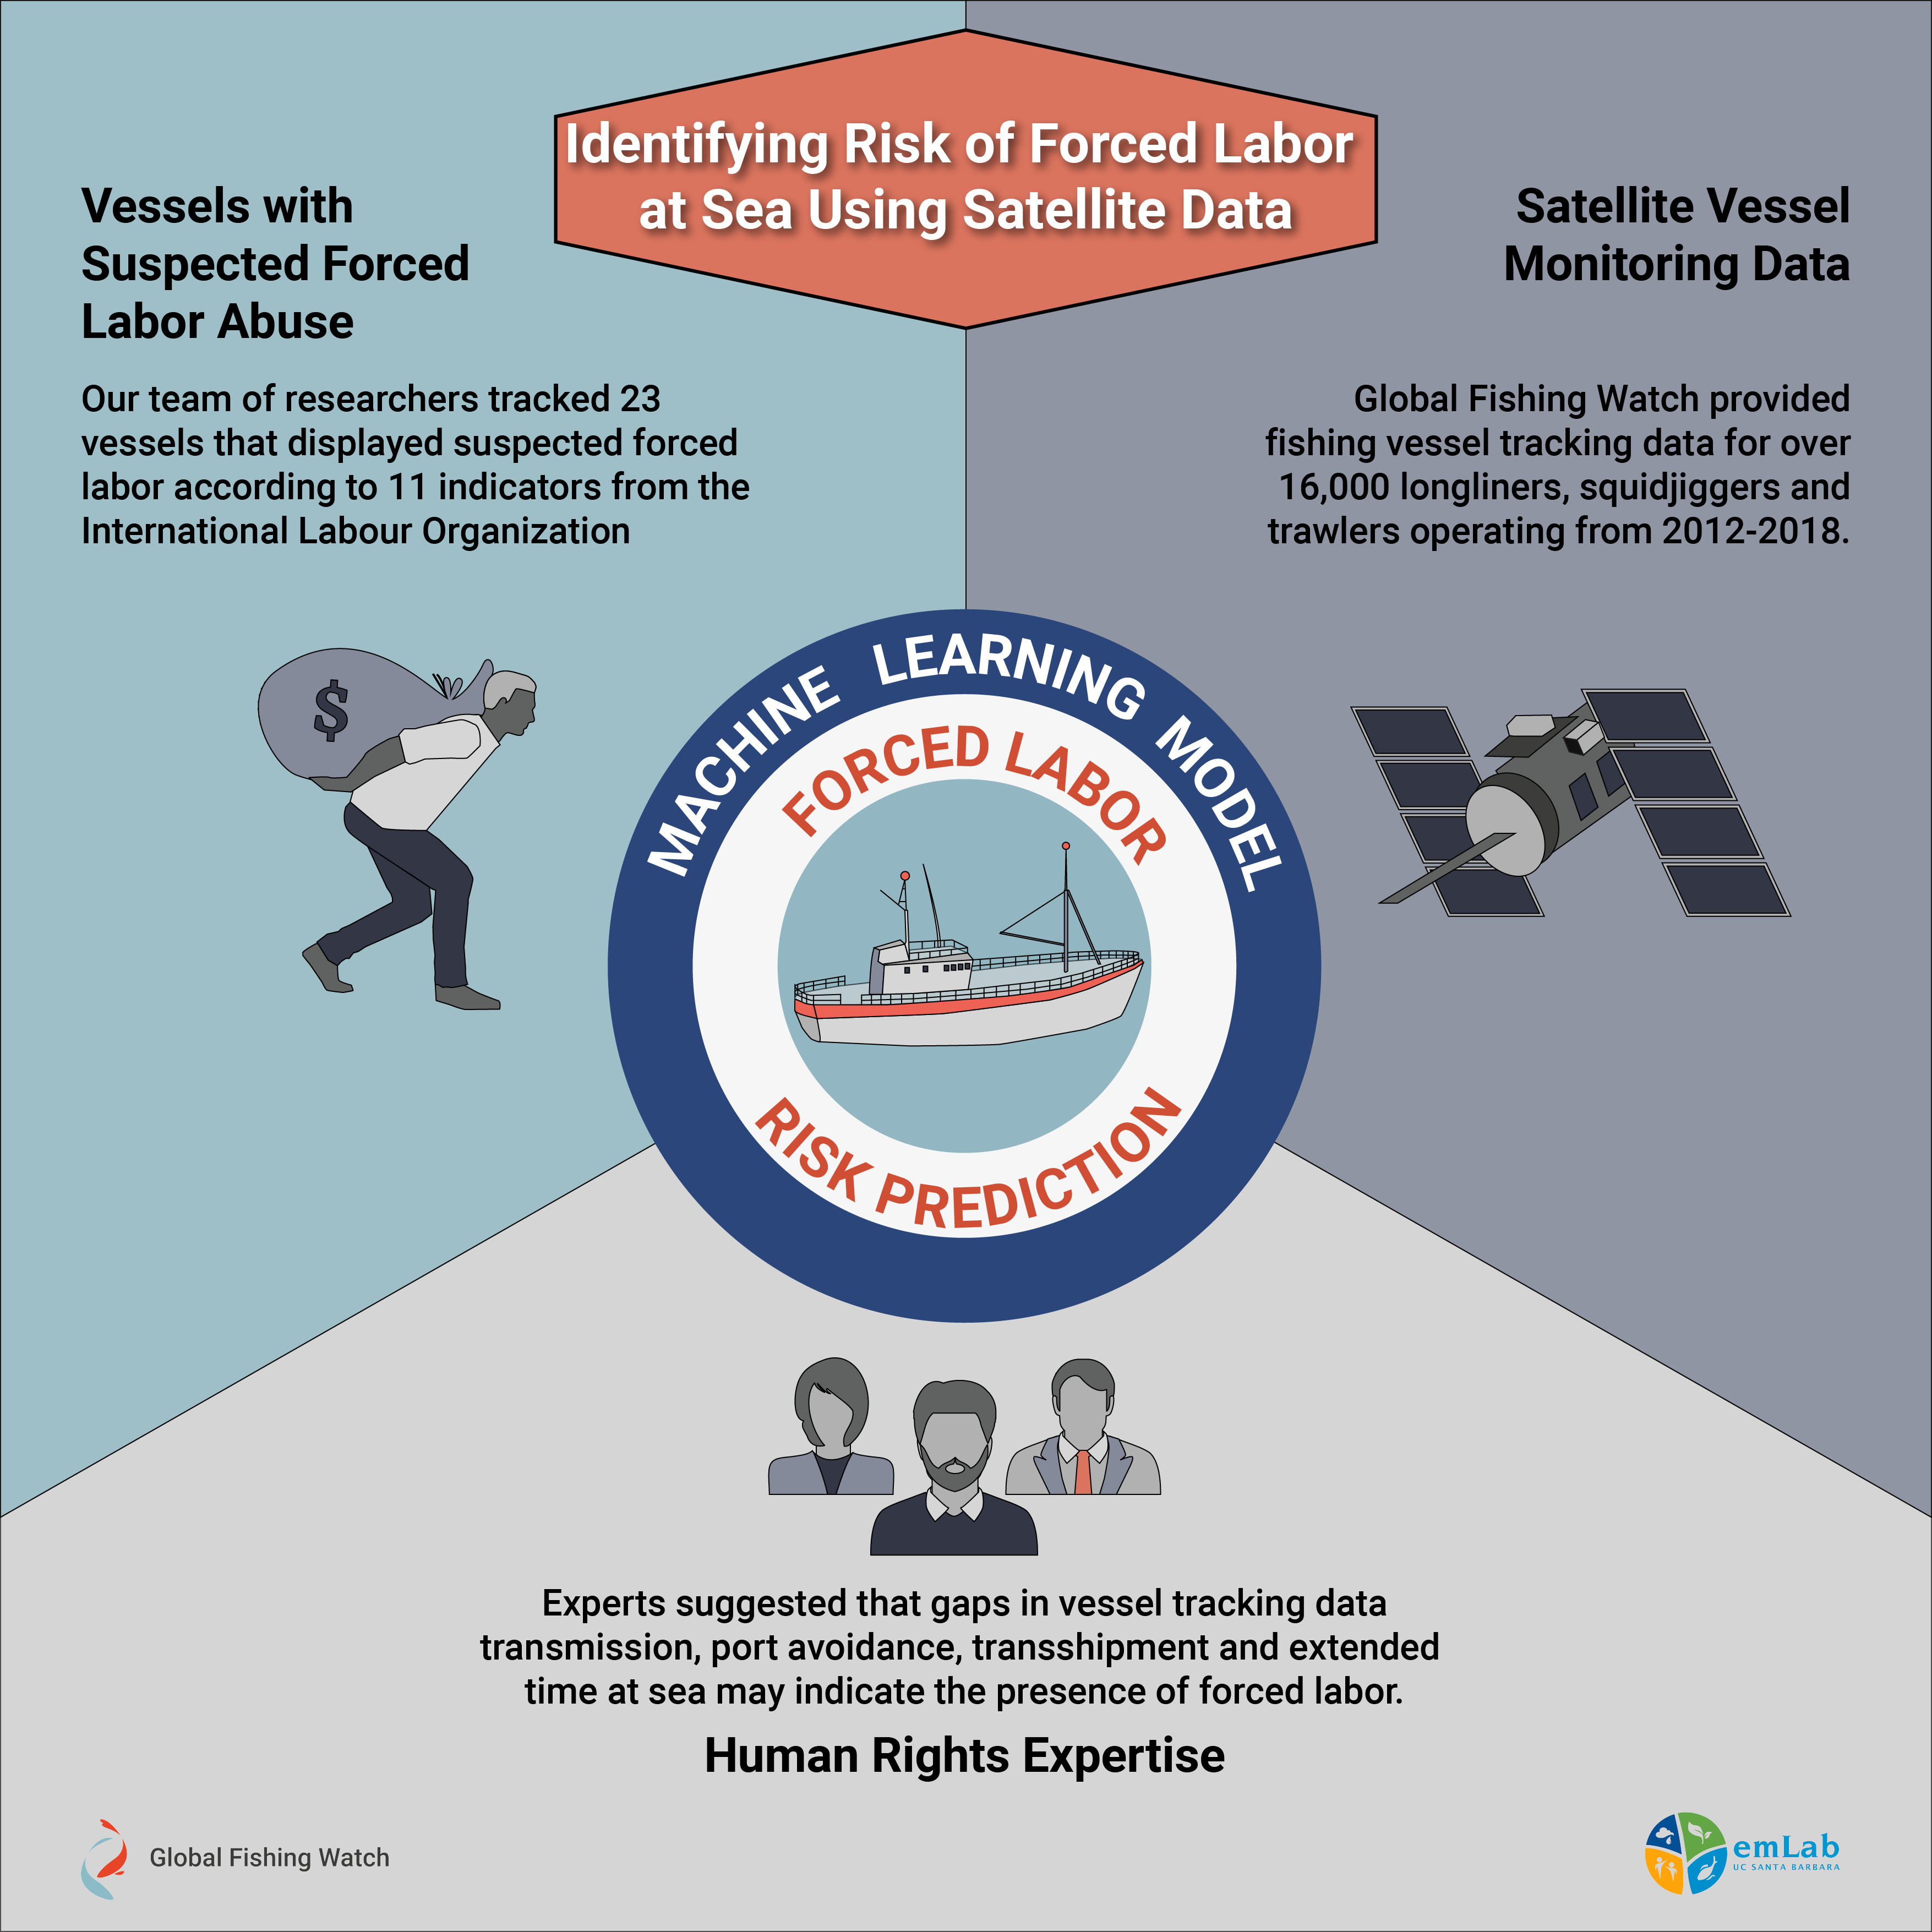
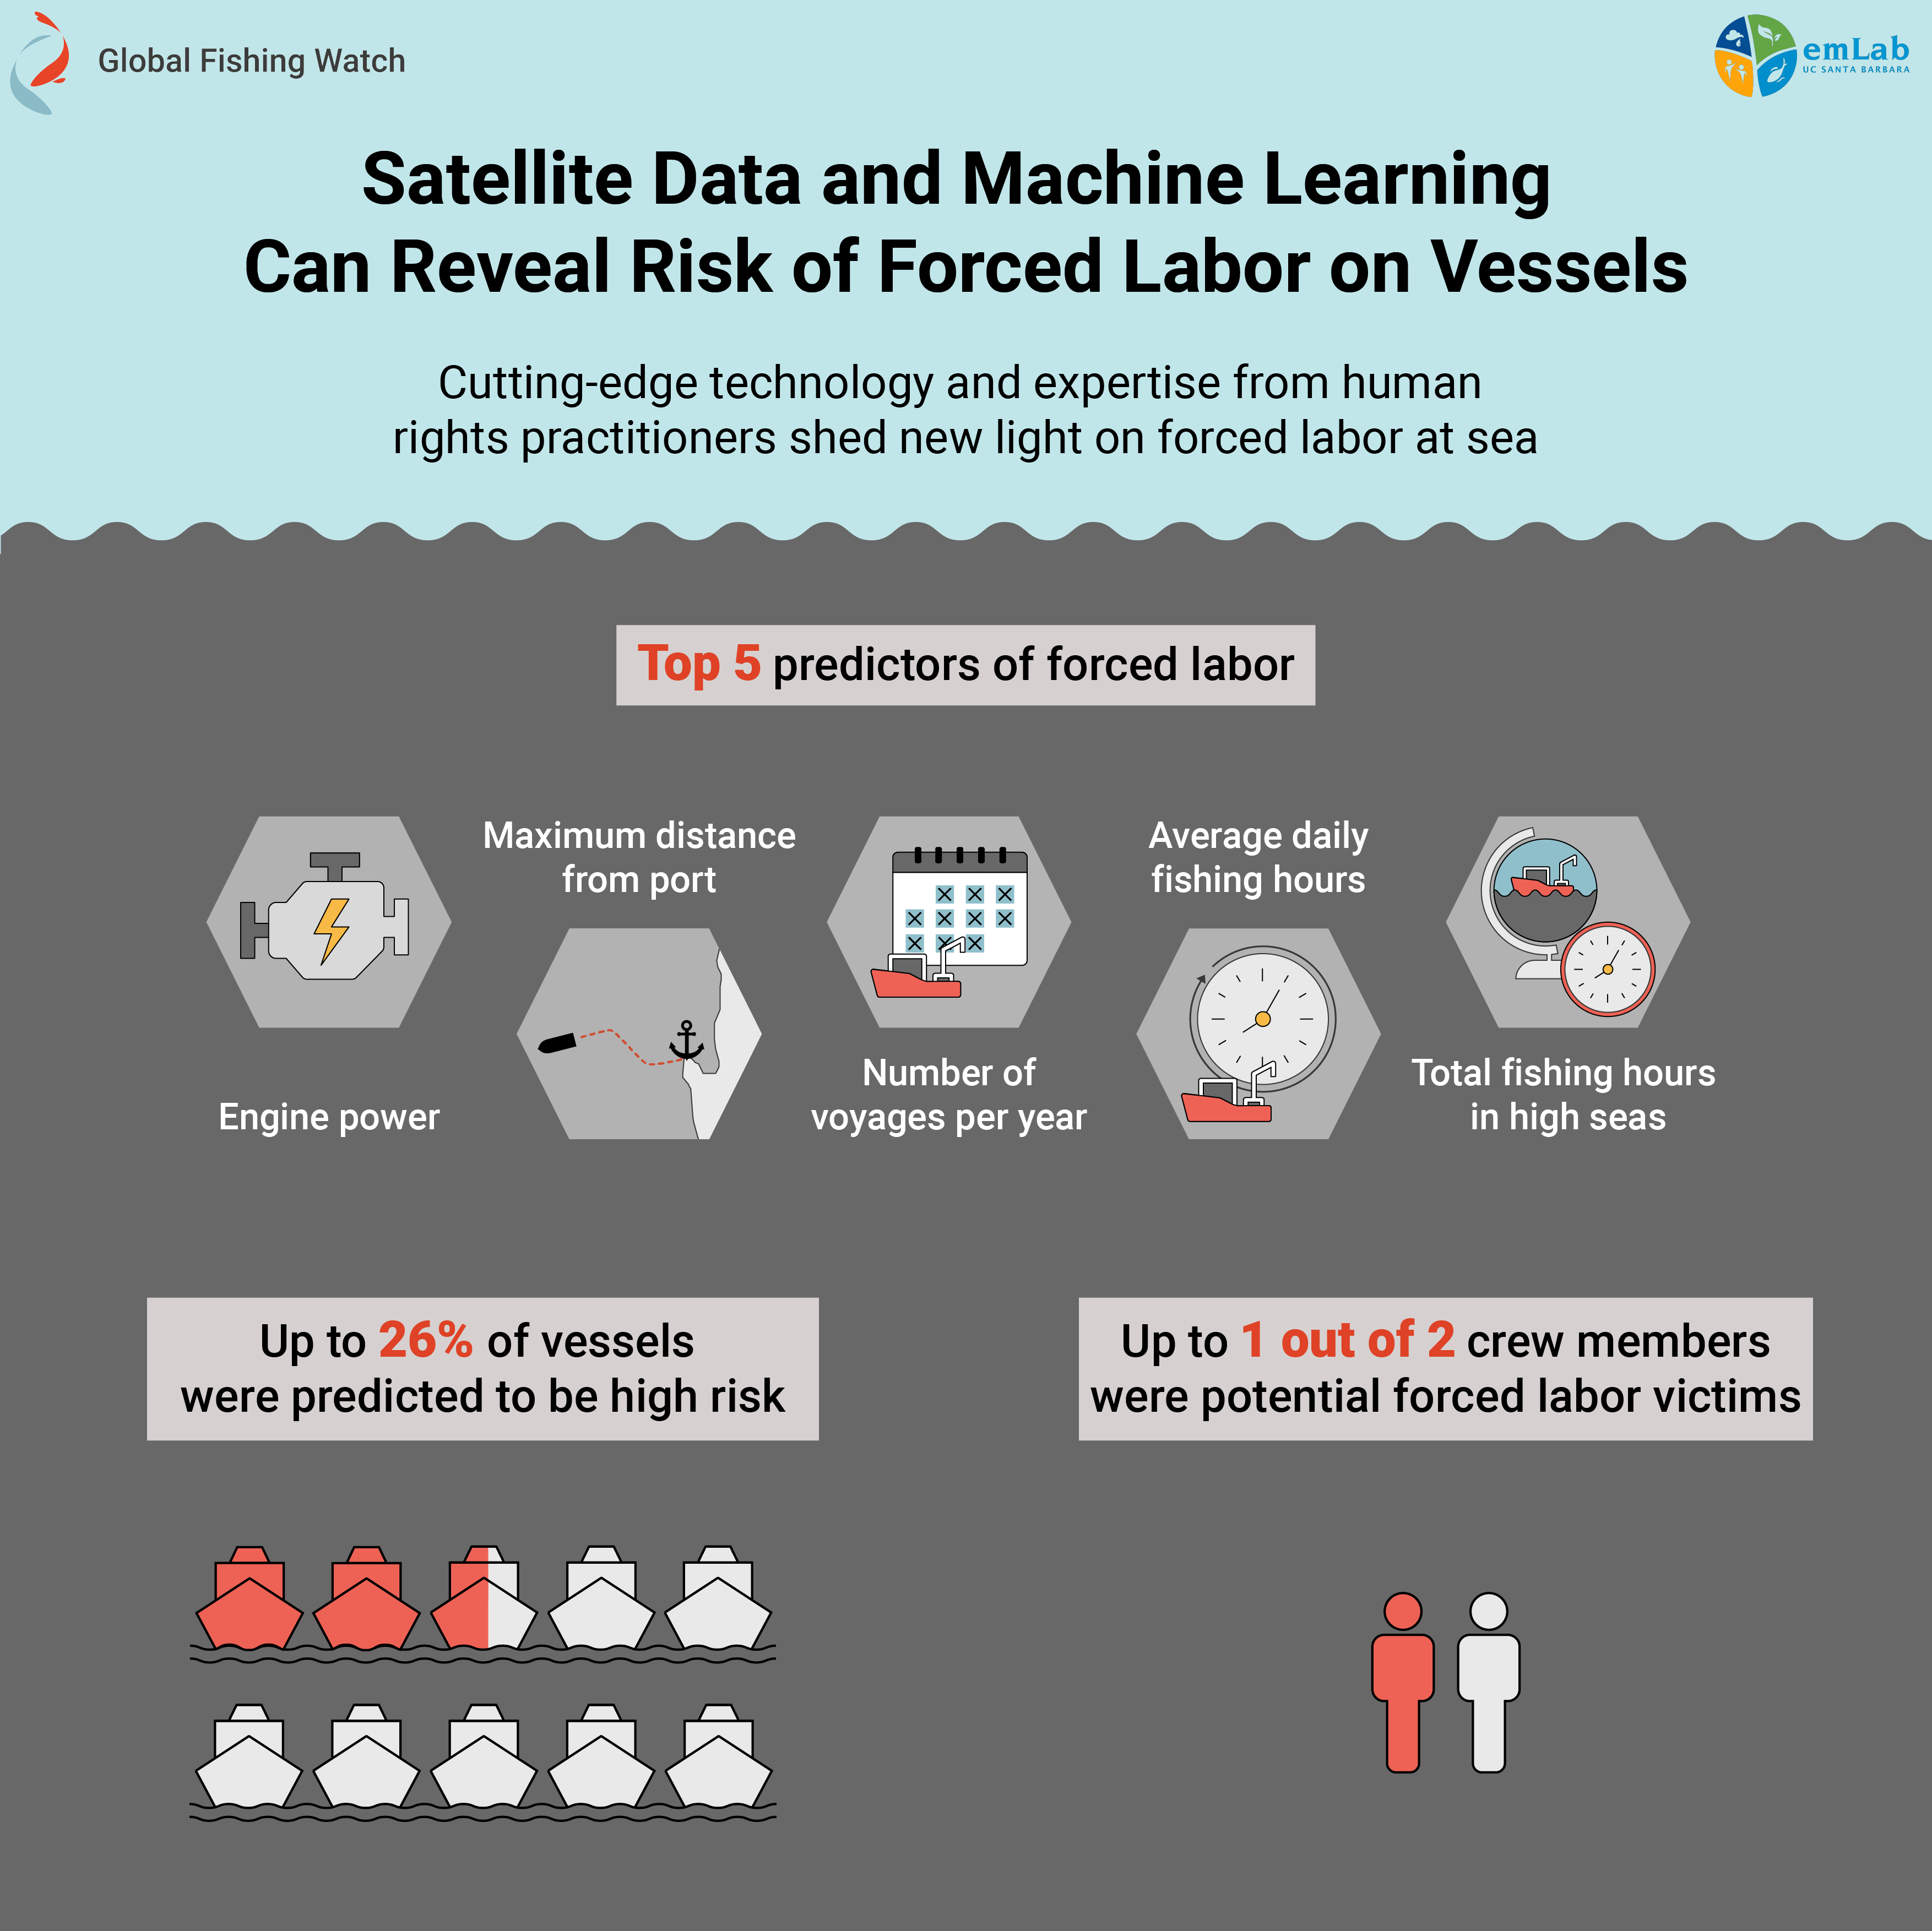
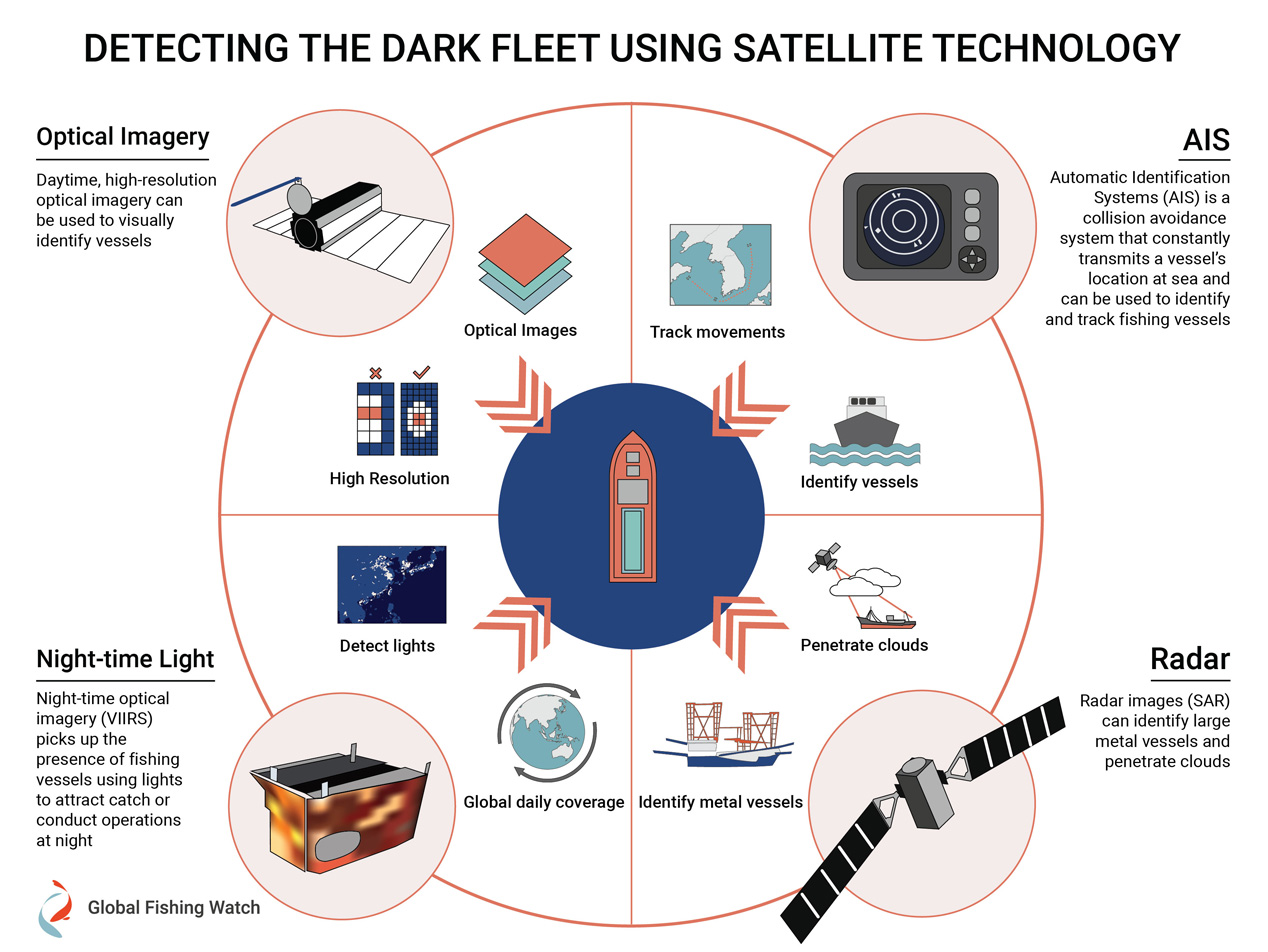
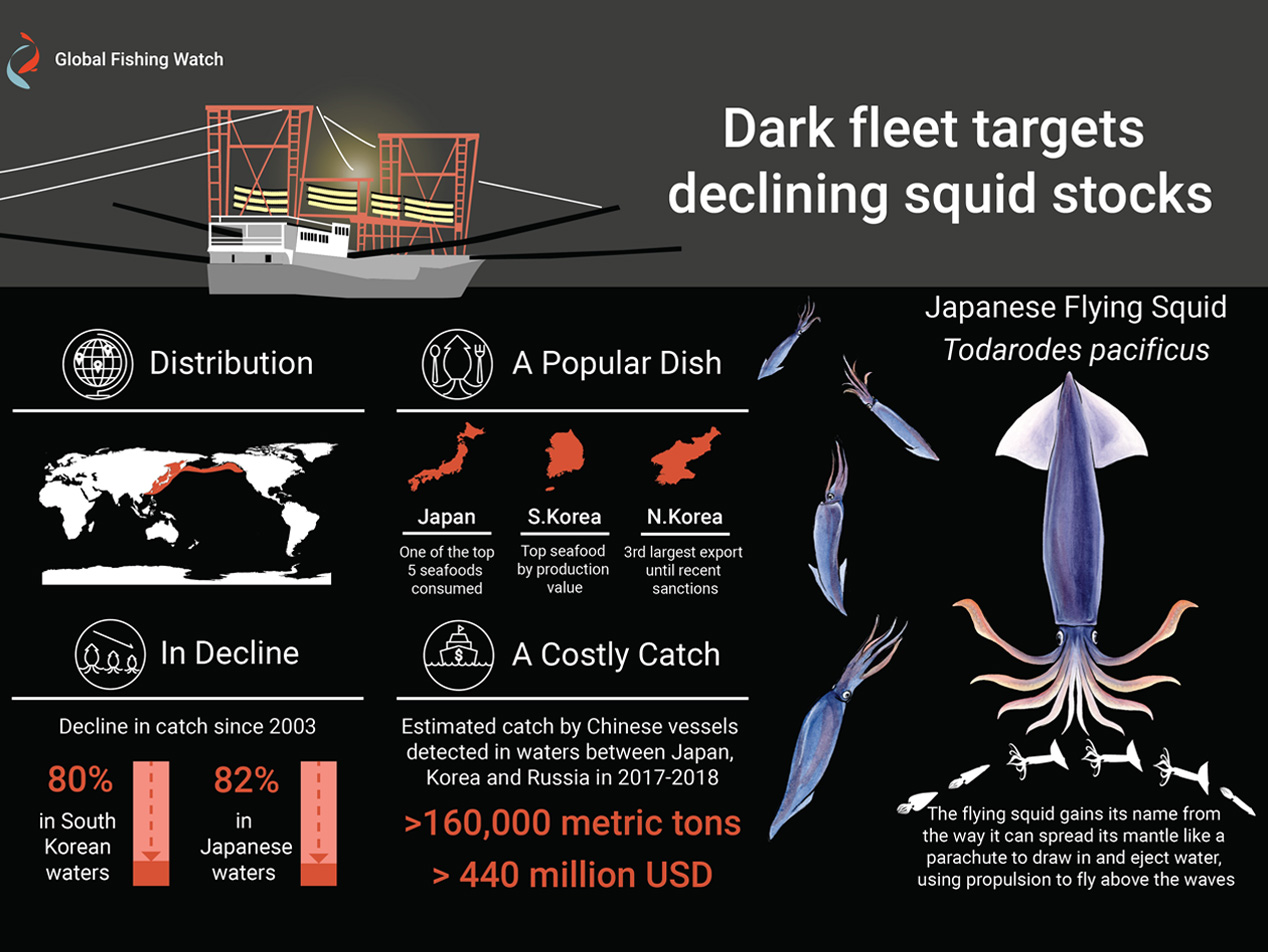
Infographics: Illuminating dark fishing fleets in North Korea
Infographics, Design
Animated GIF: North Korean Fishing Vessels
Data Viz, Animation
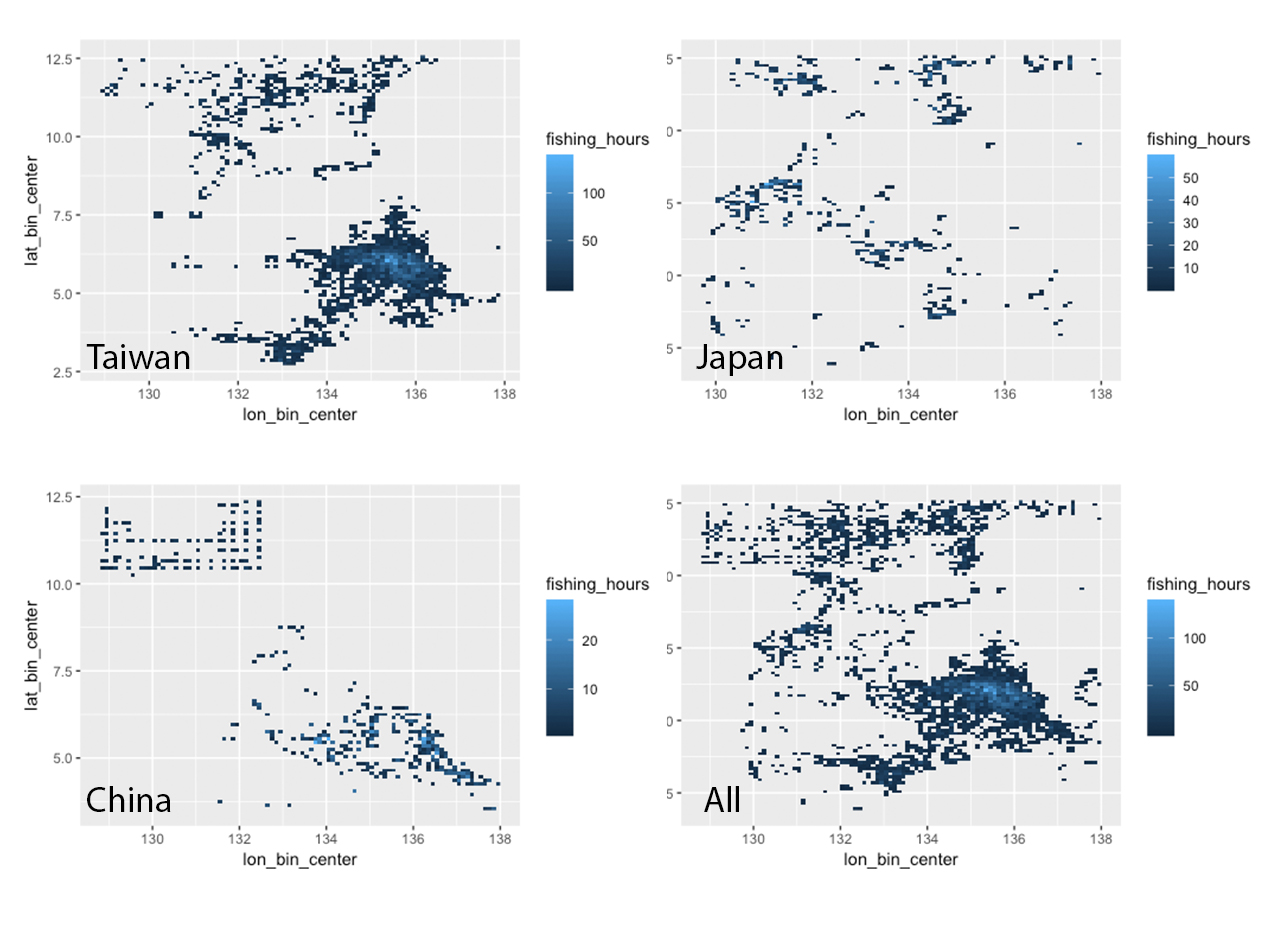
Spatial Statistics: Fishing Effort
R, Spatial Stats, BigQuery
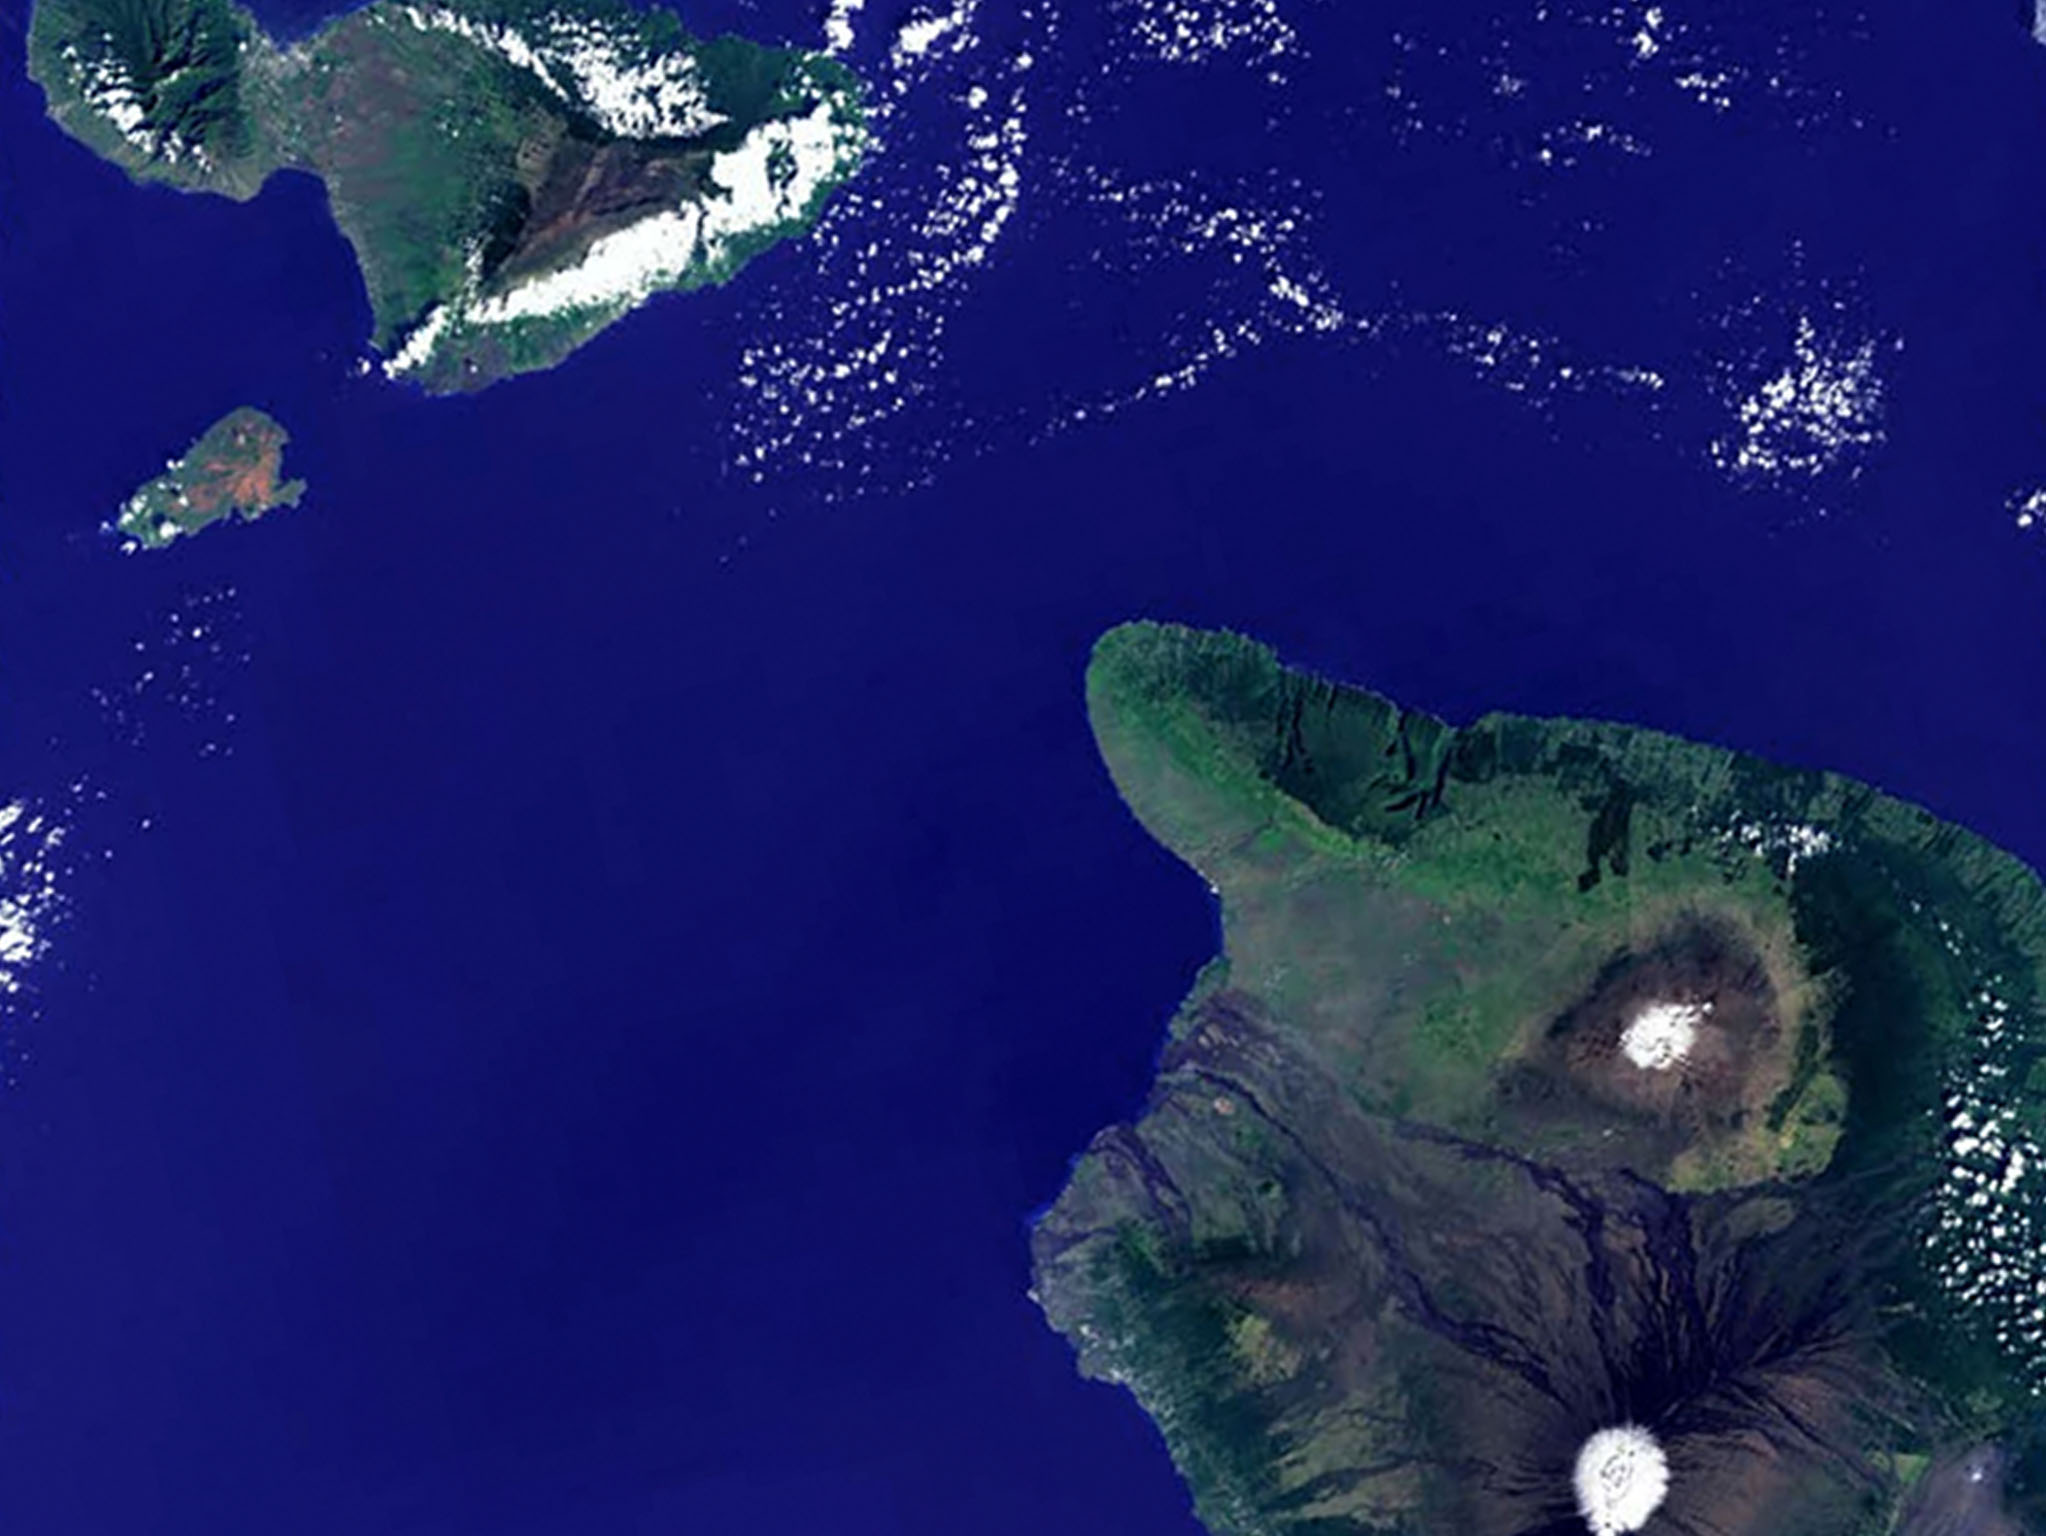
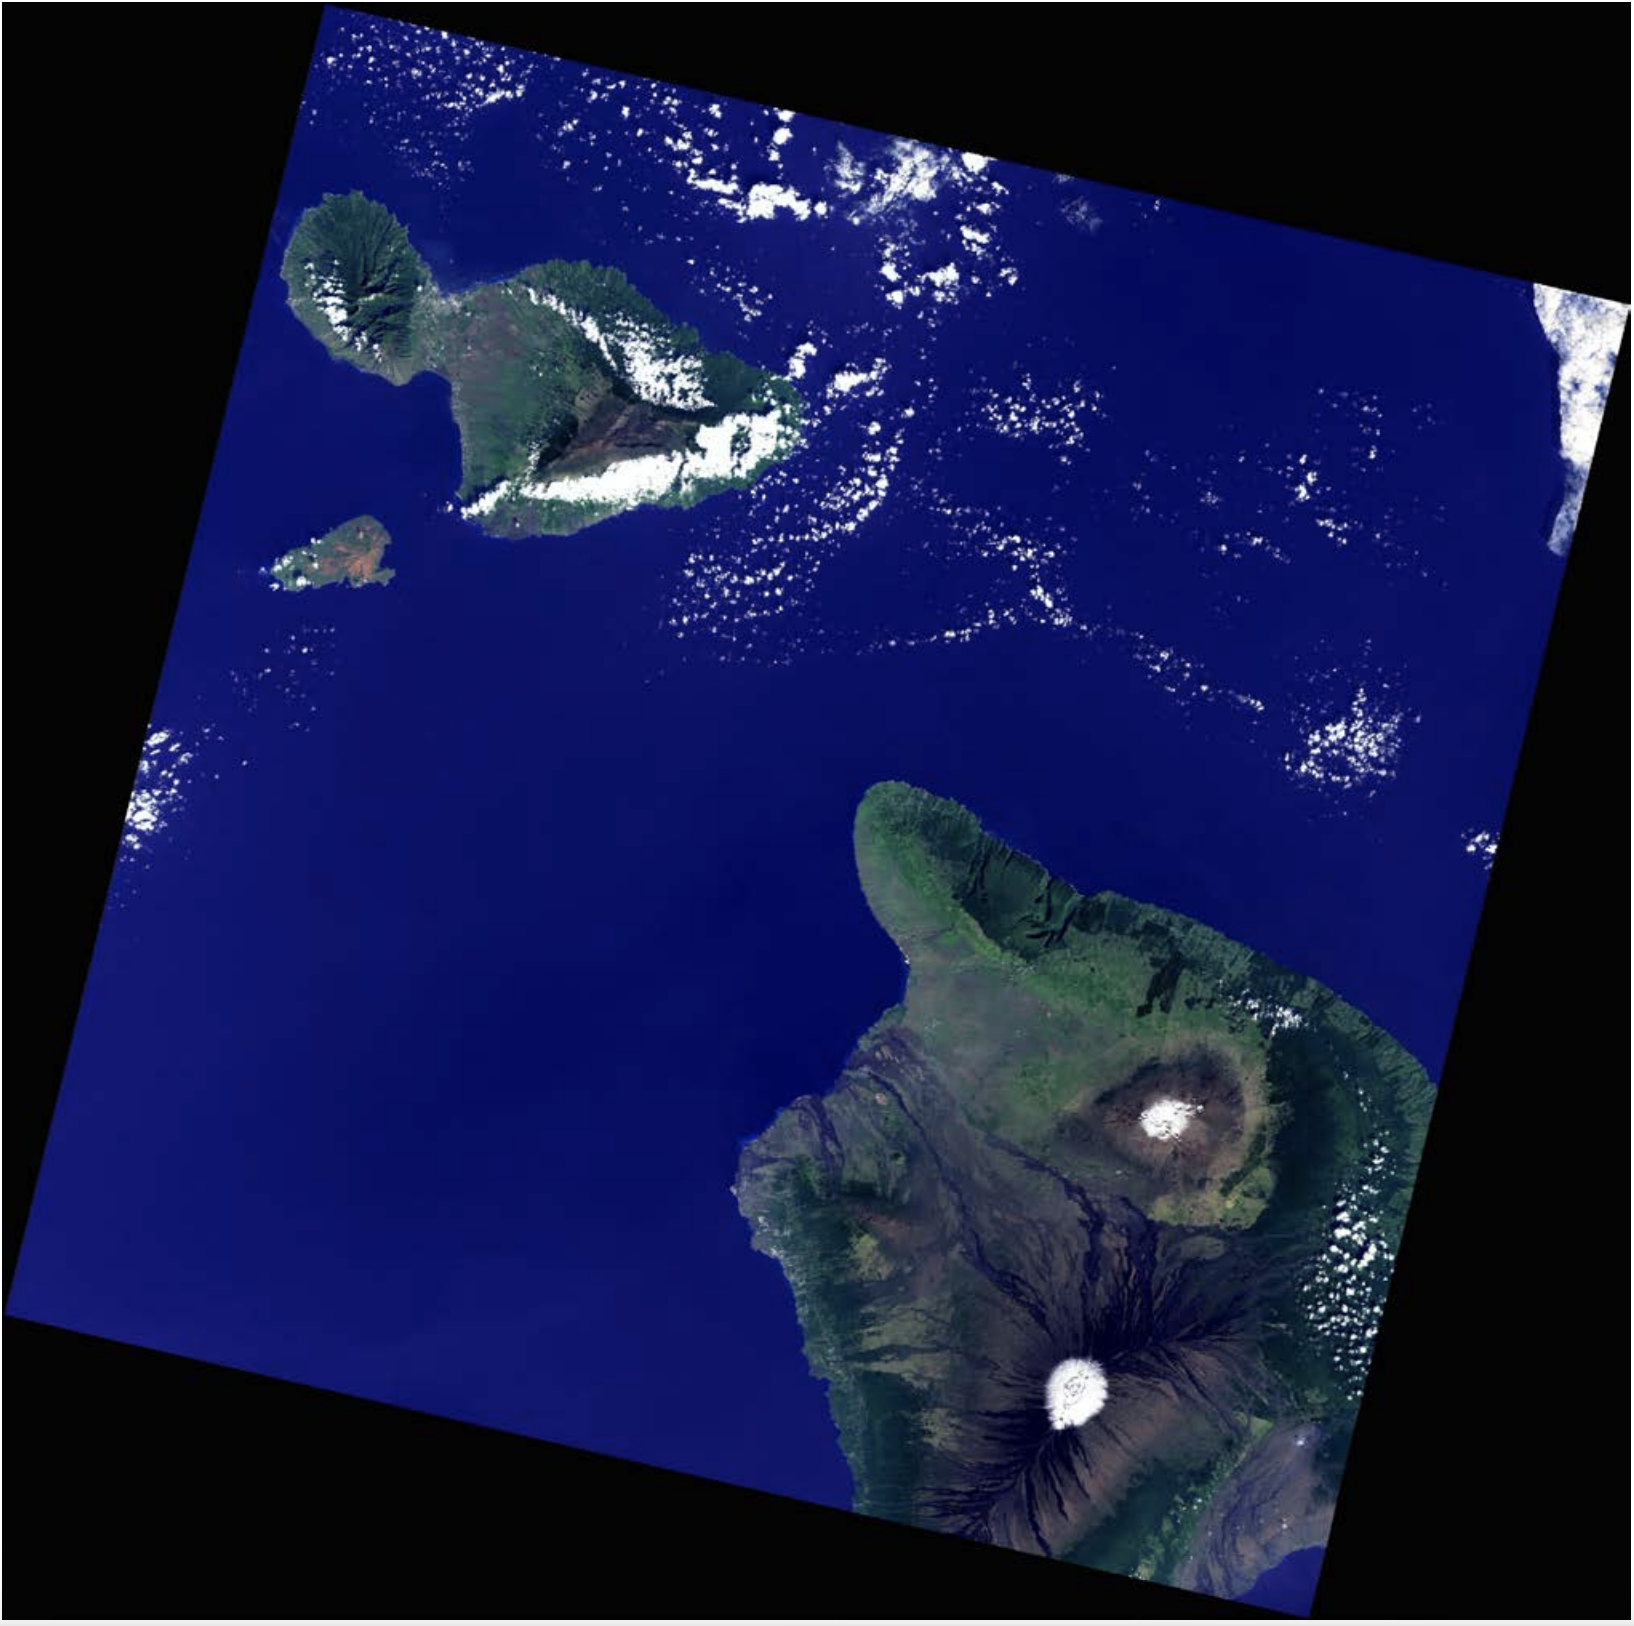
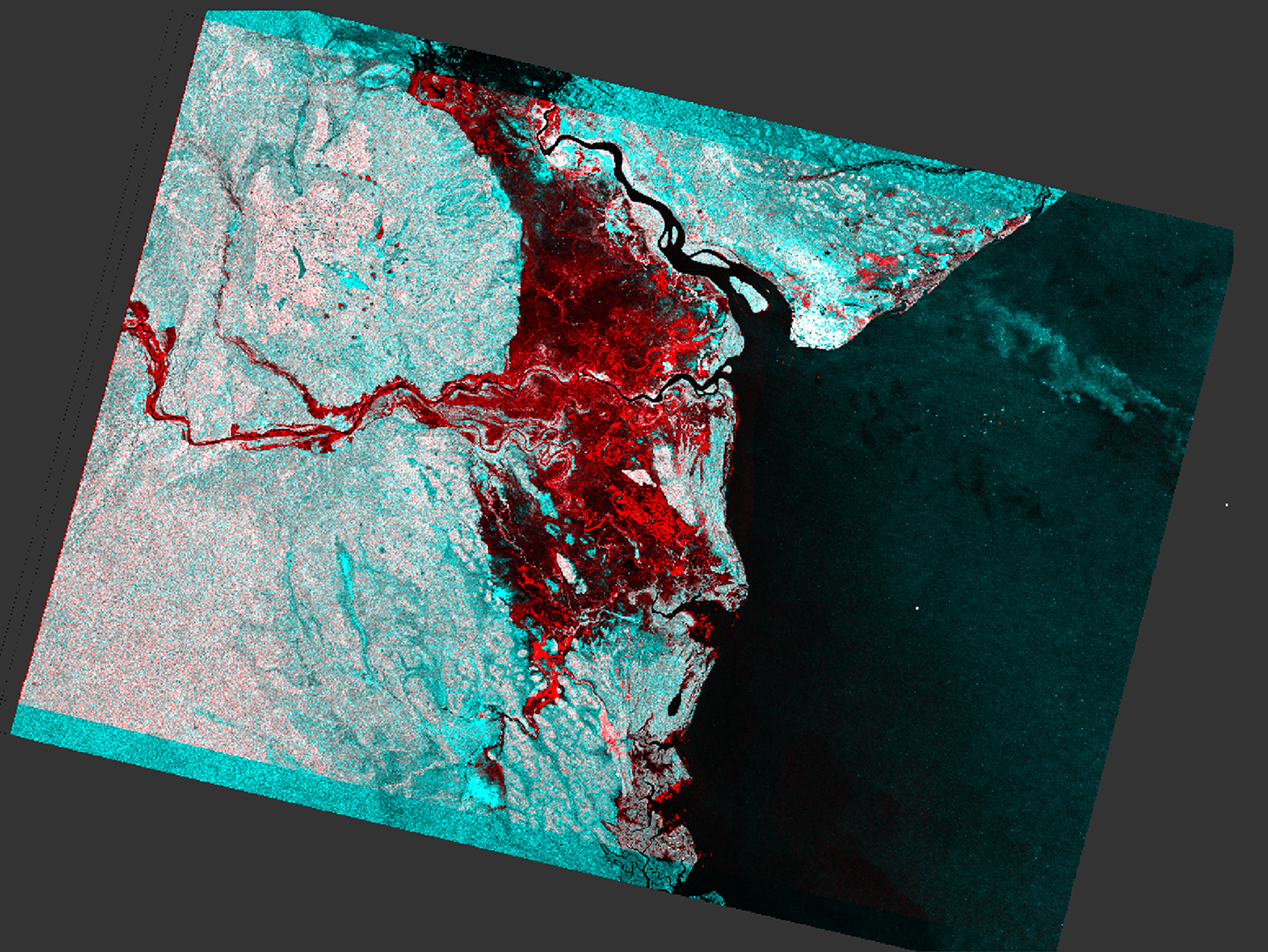
Satellite Image Panchromatic sharpening
Remote Sensing, Photoshop
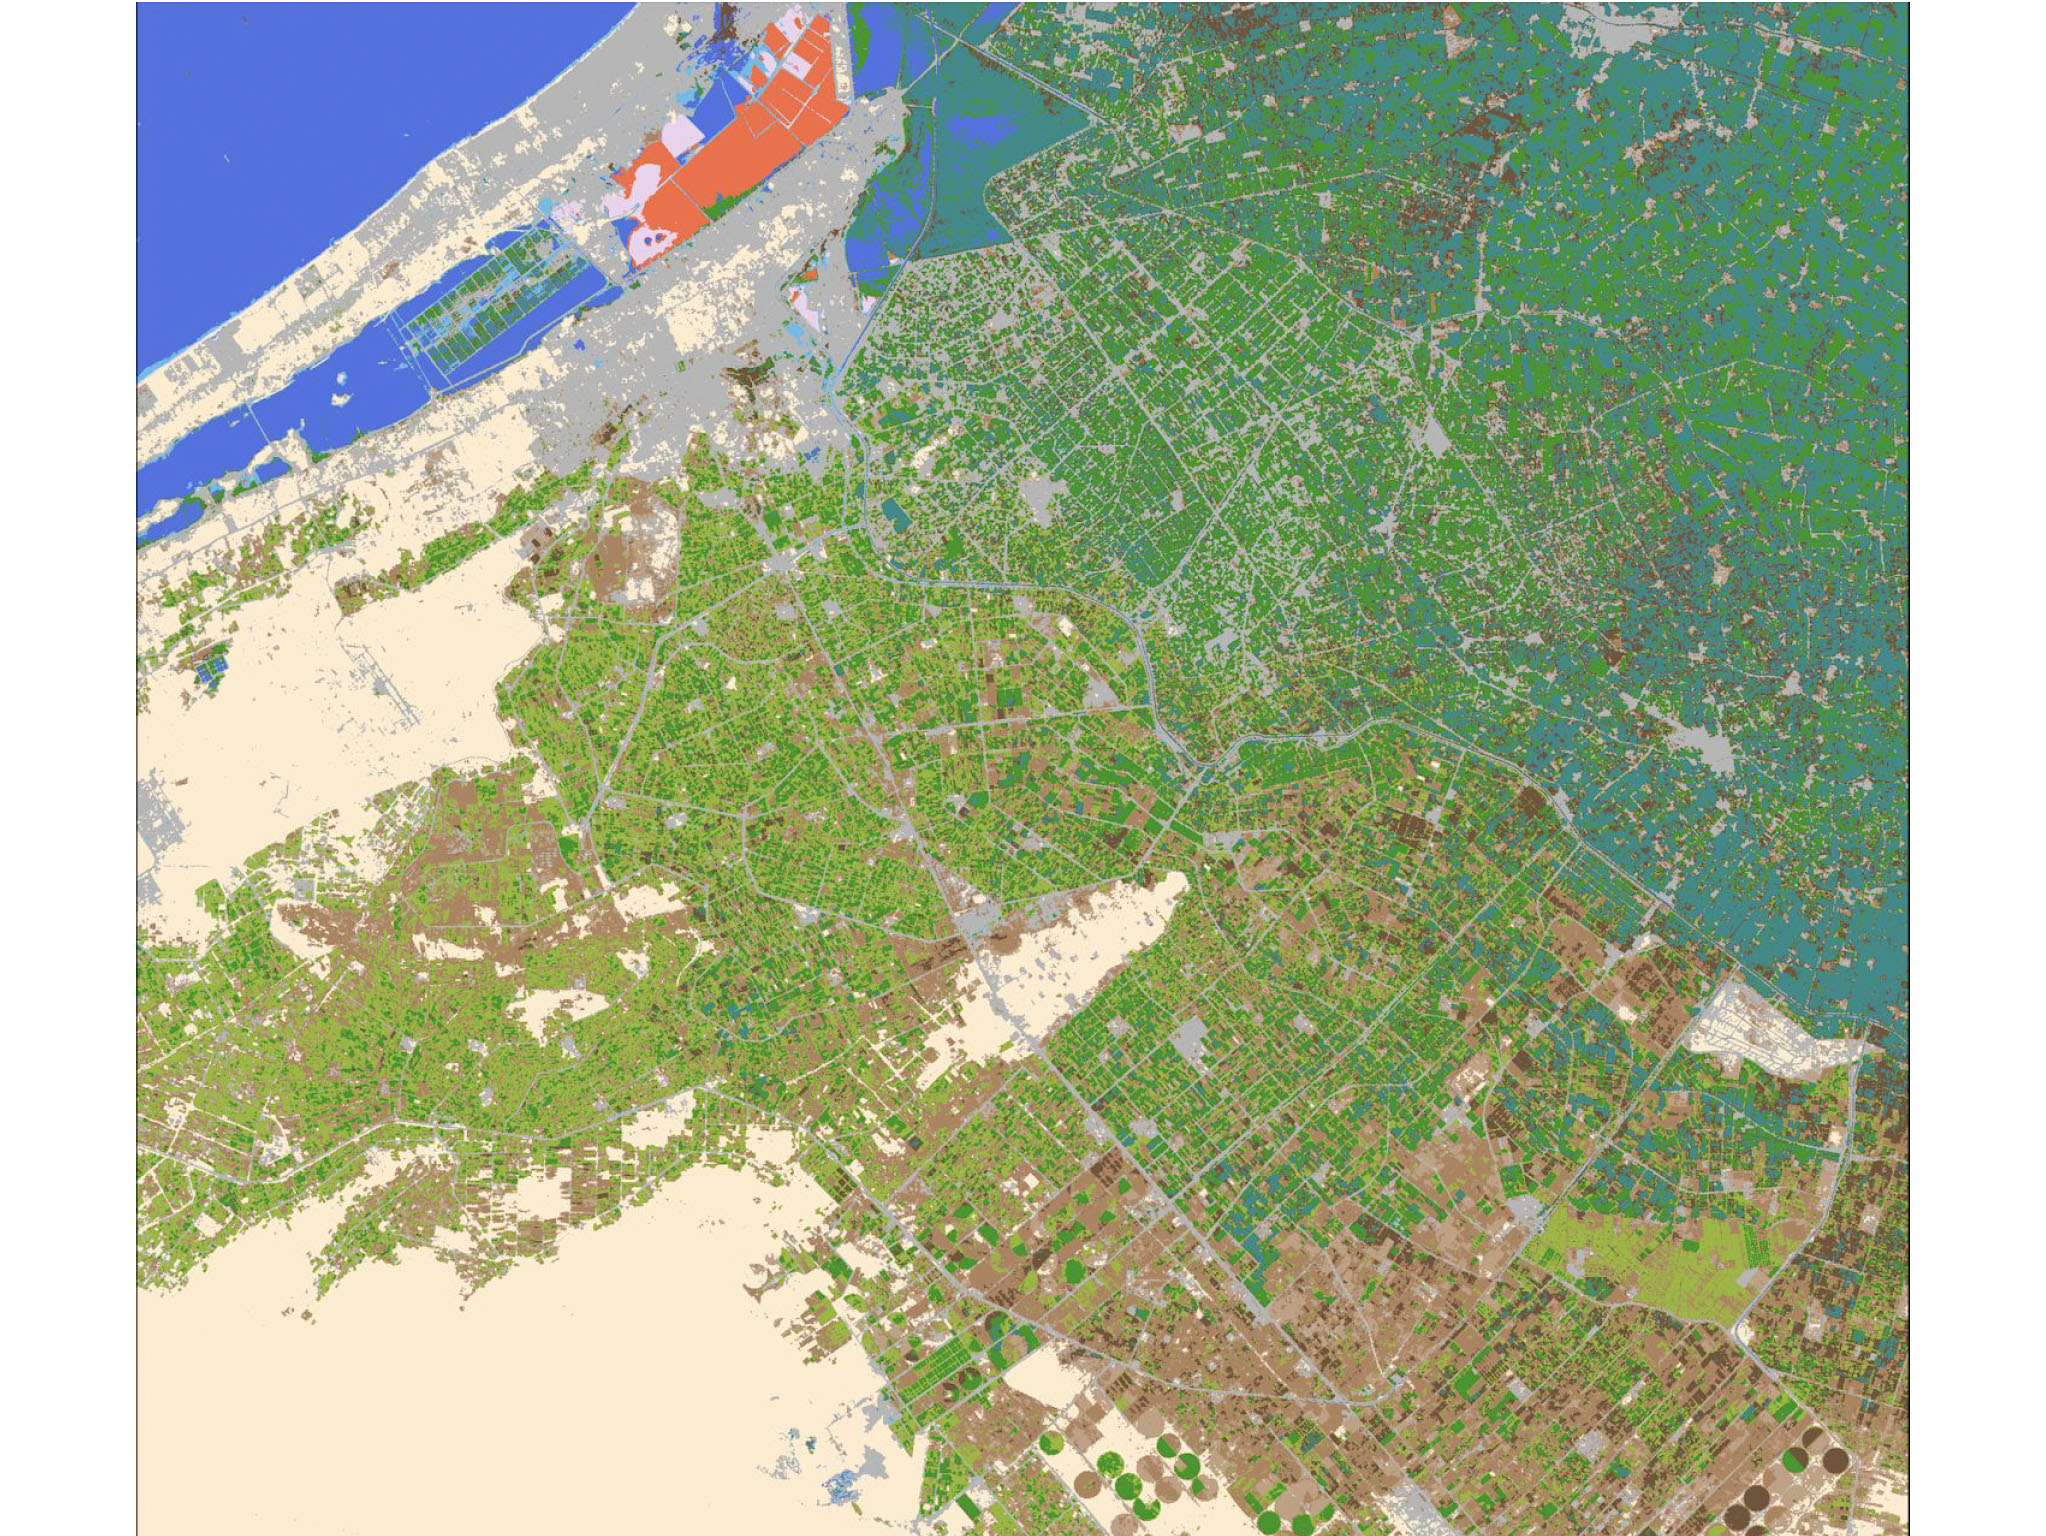
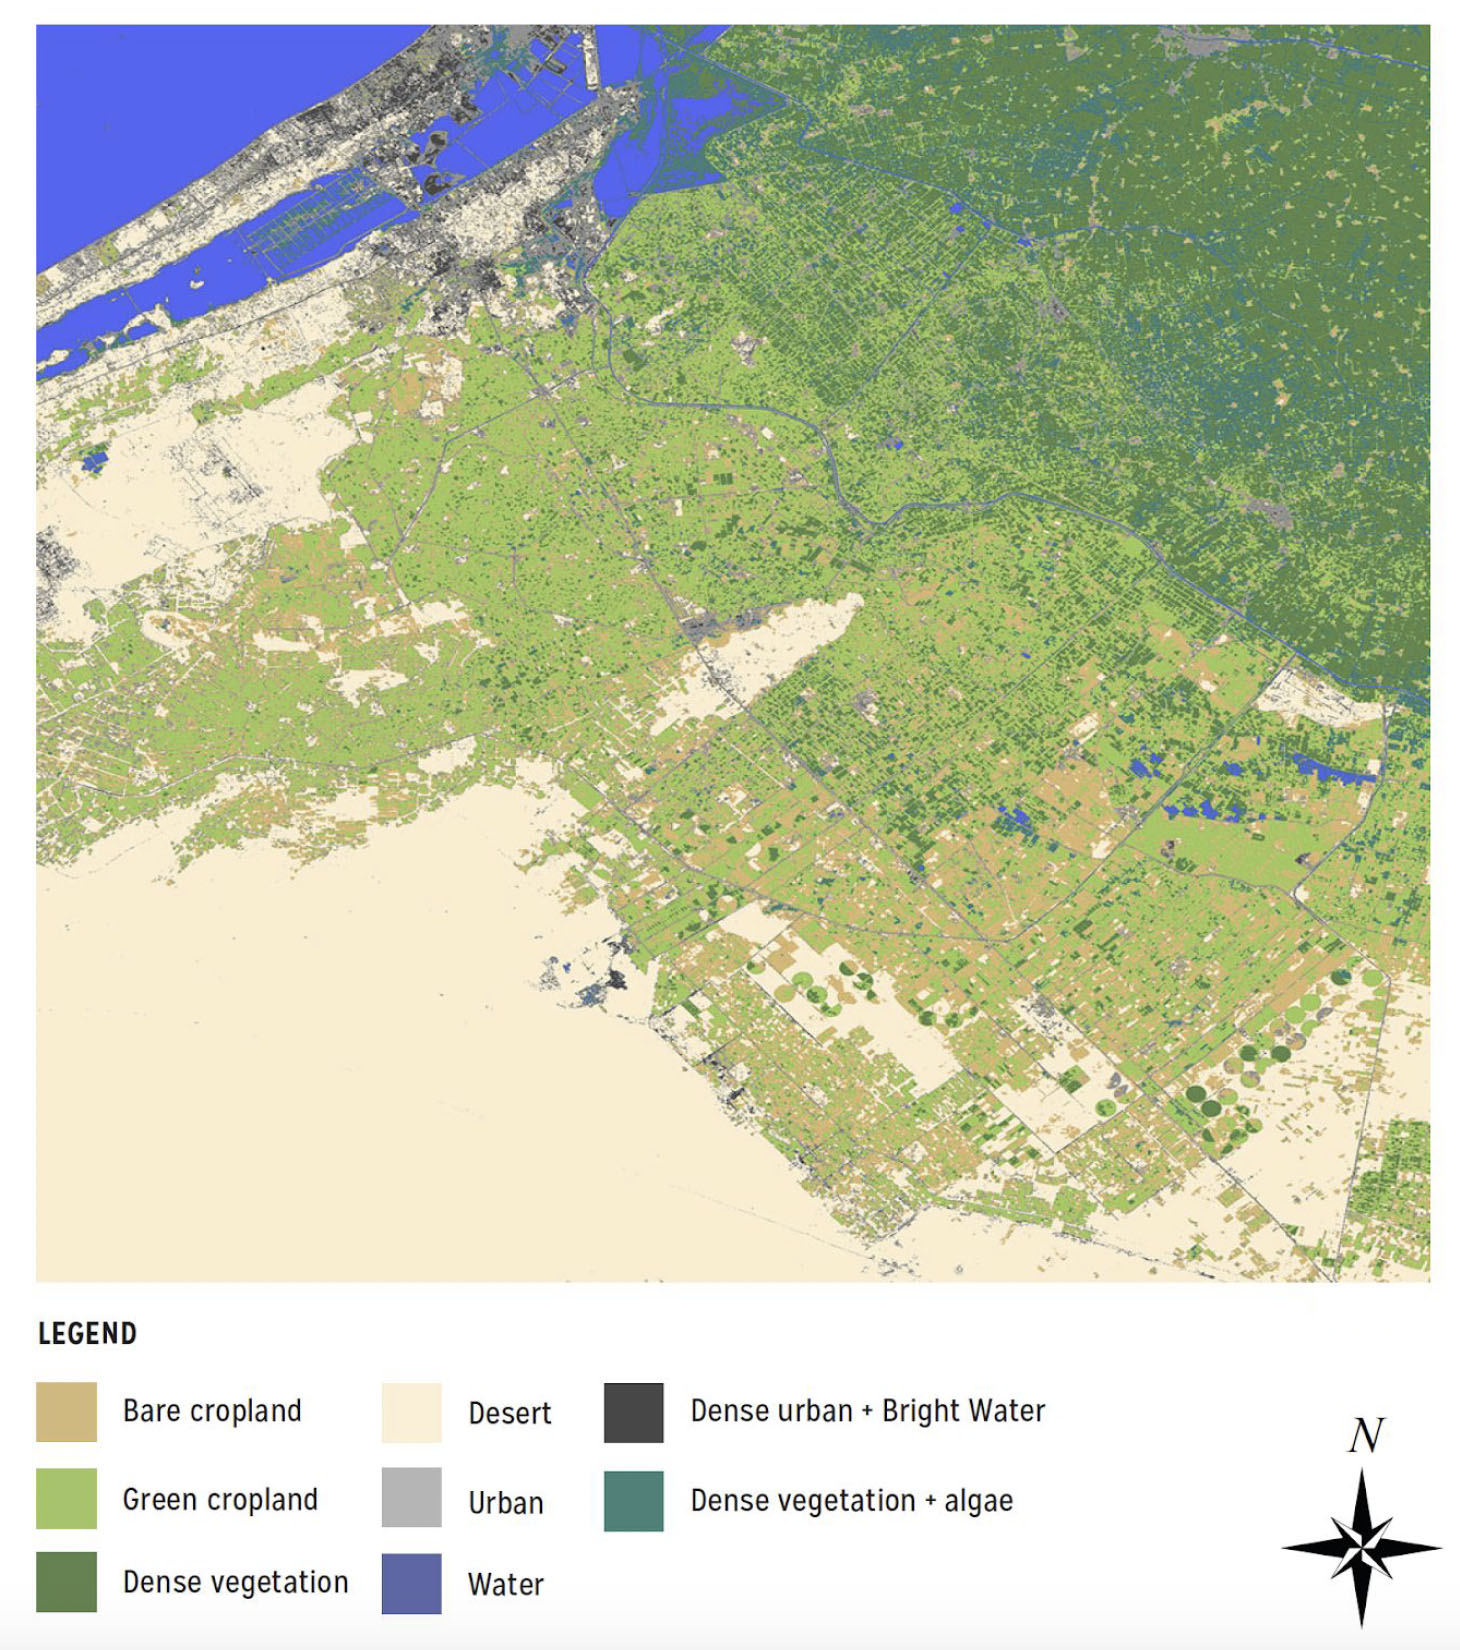
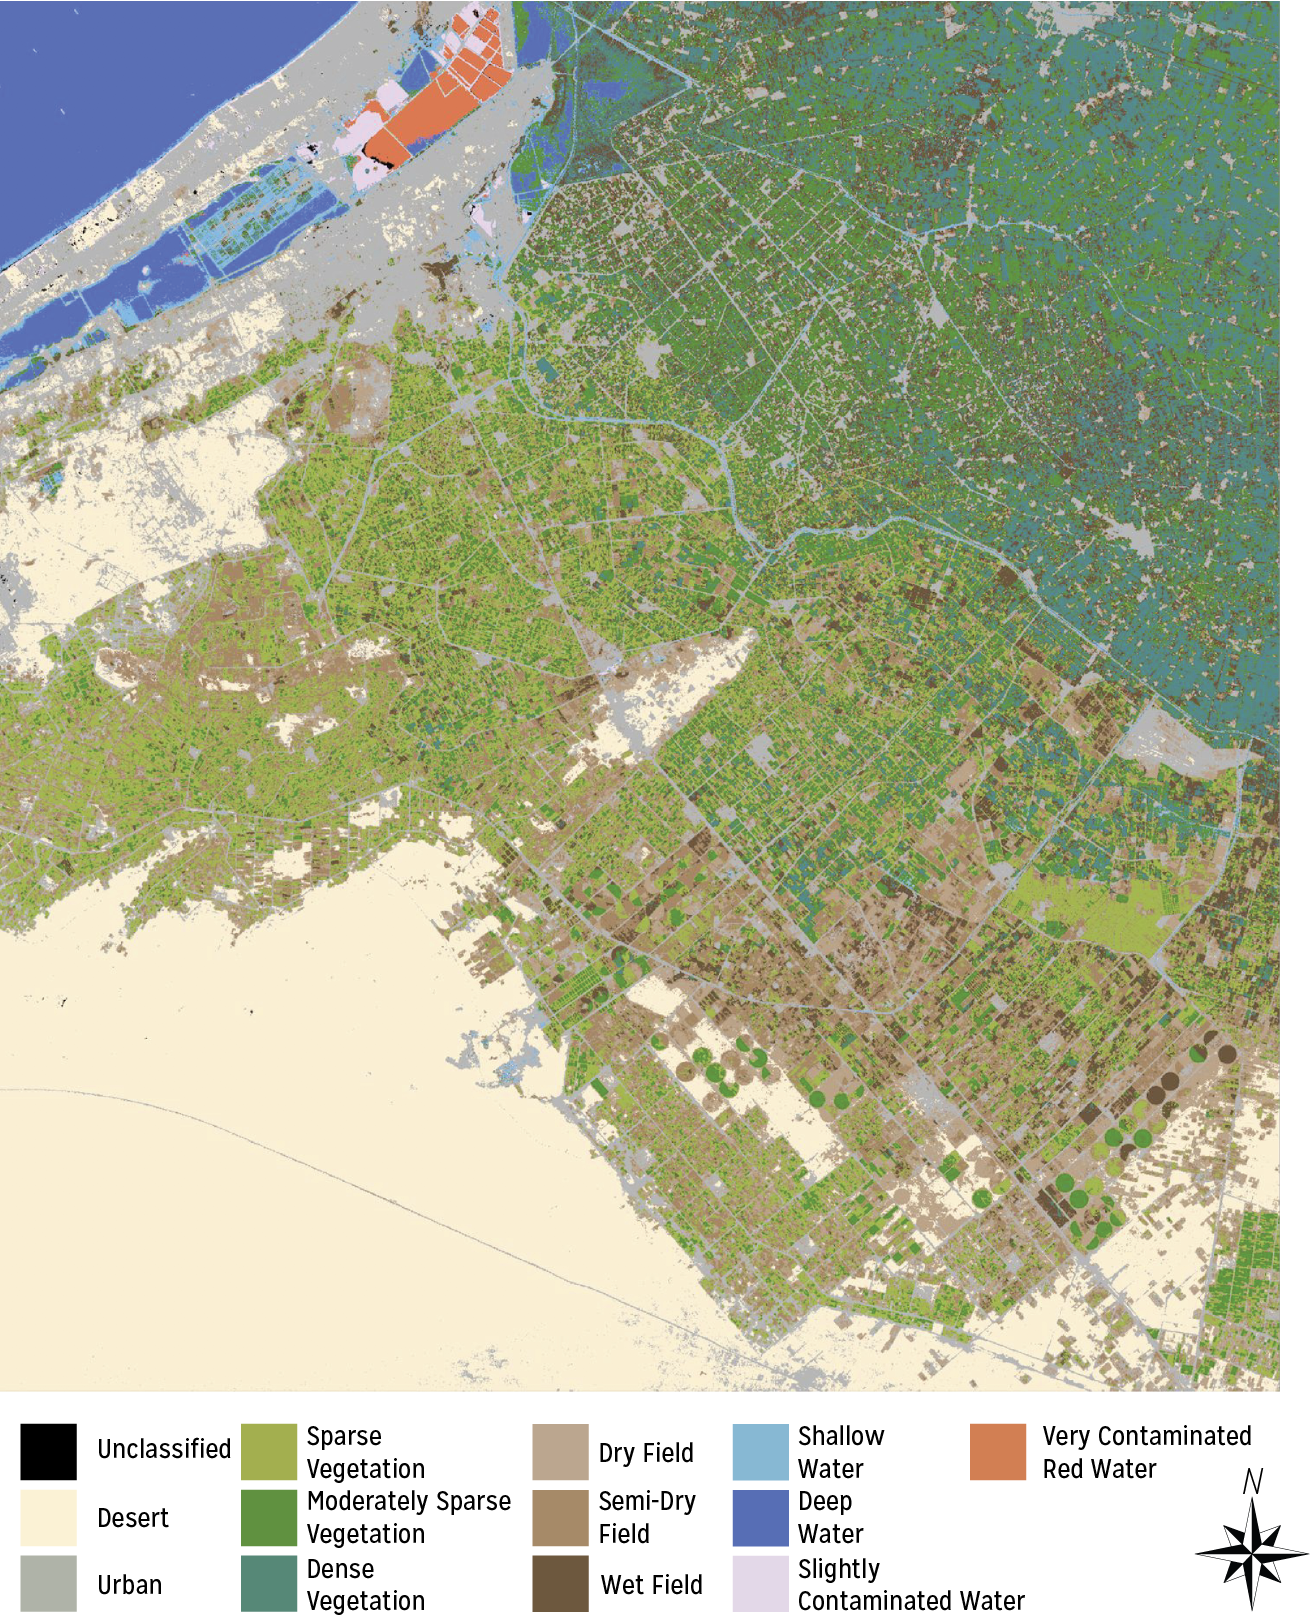
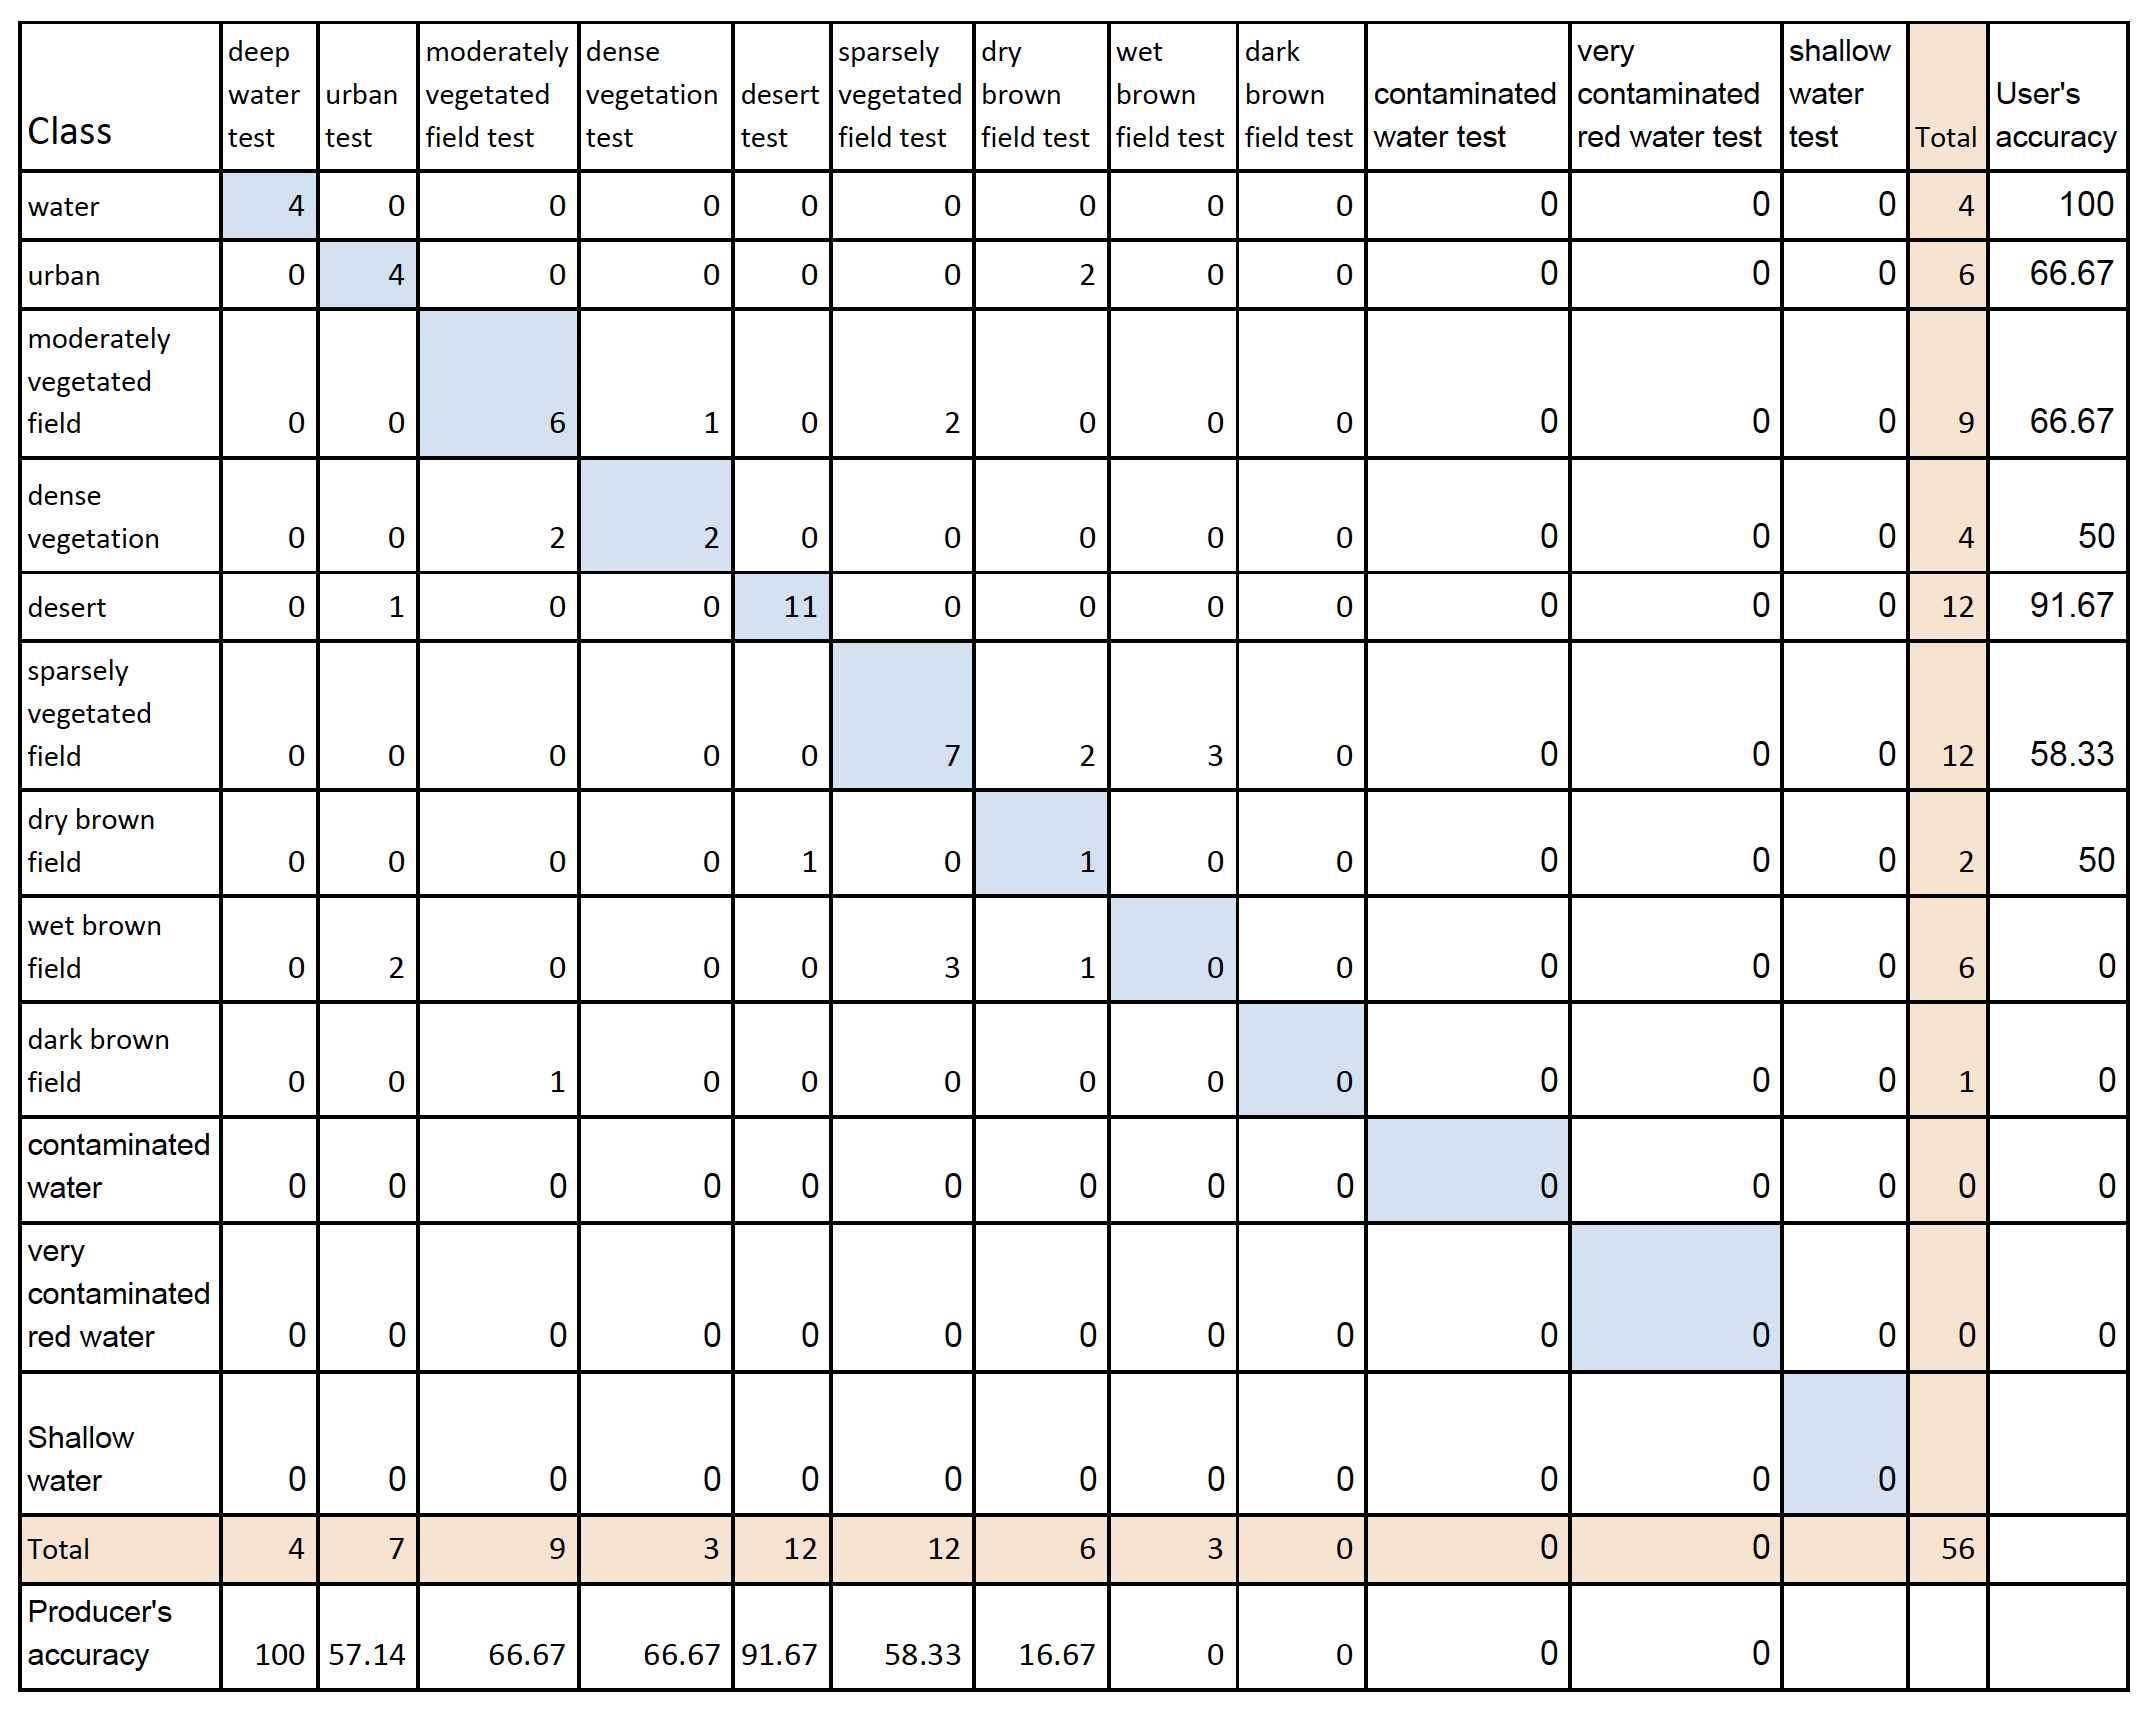
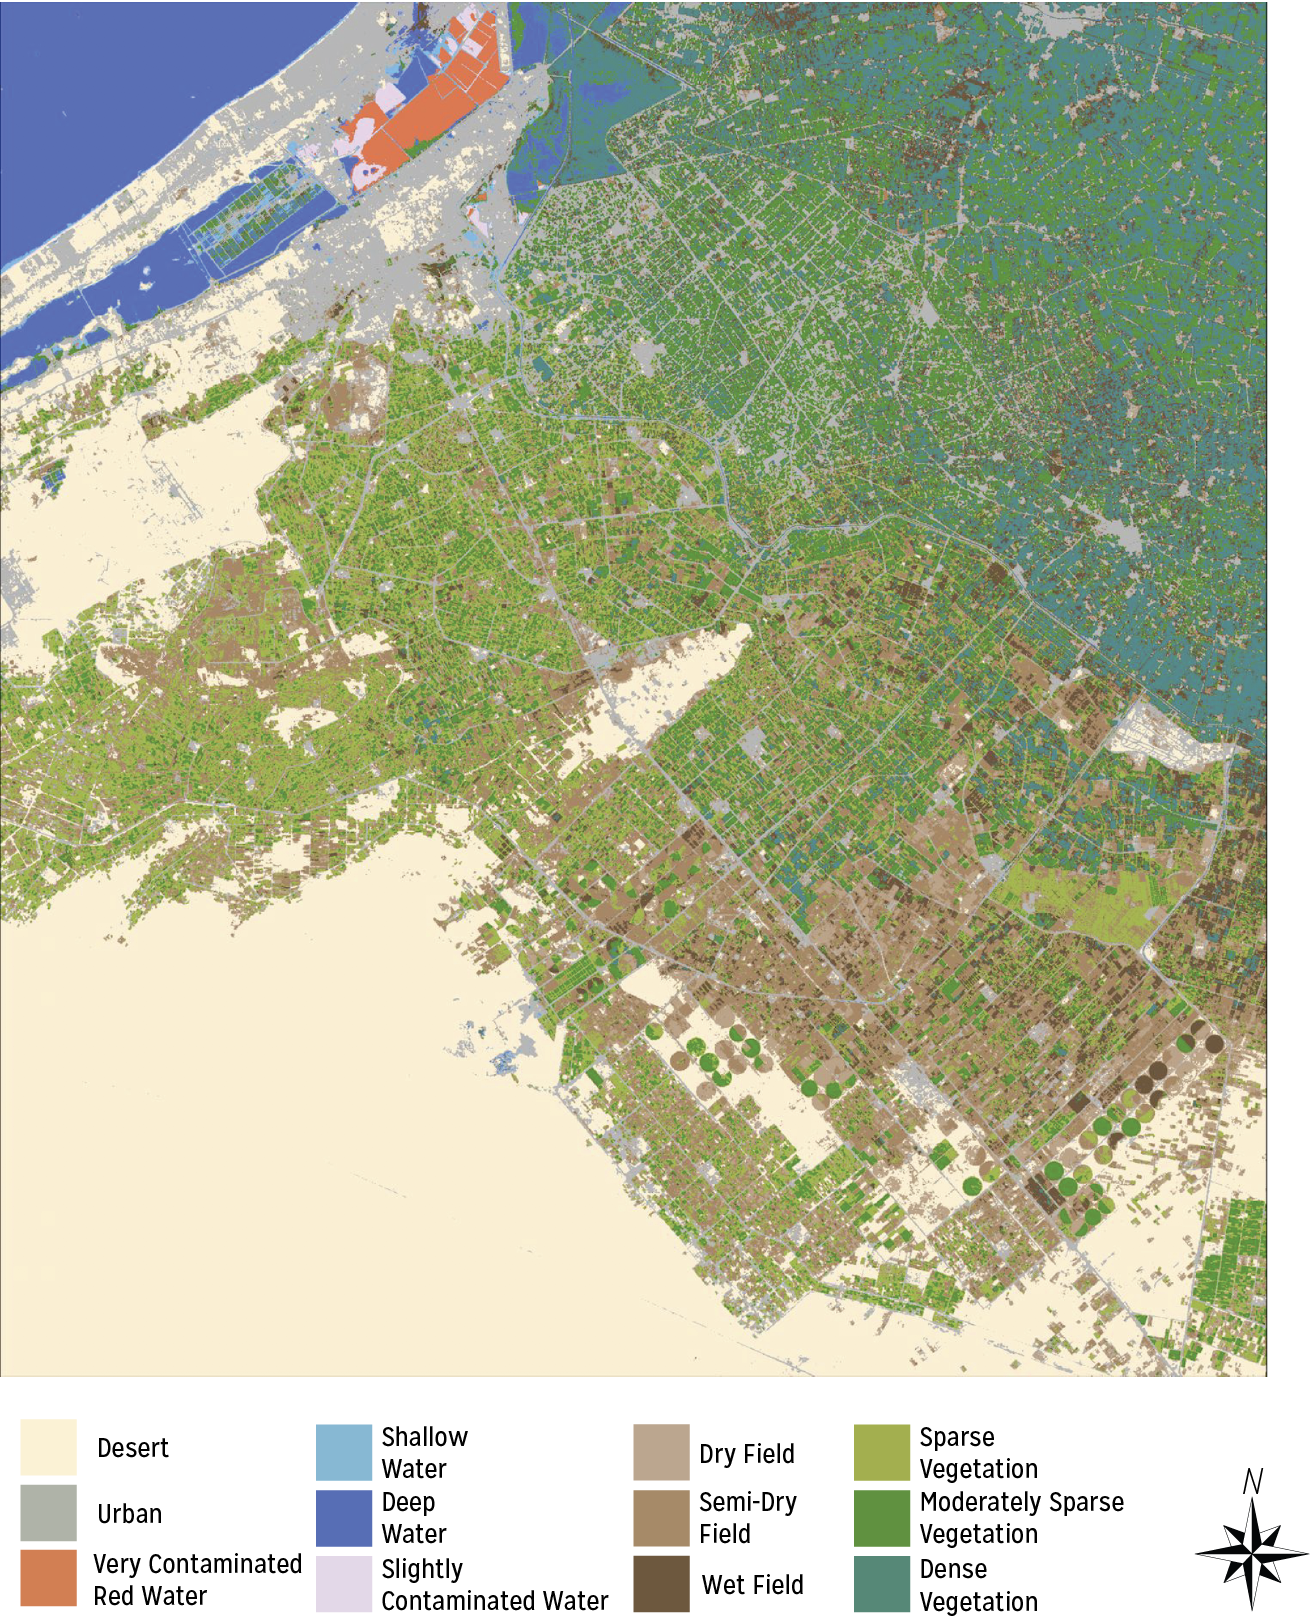
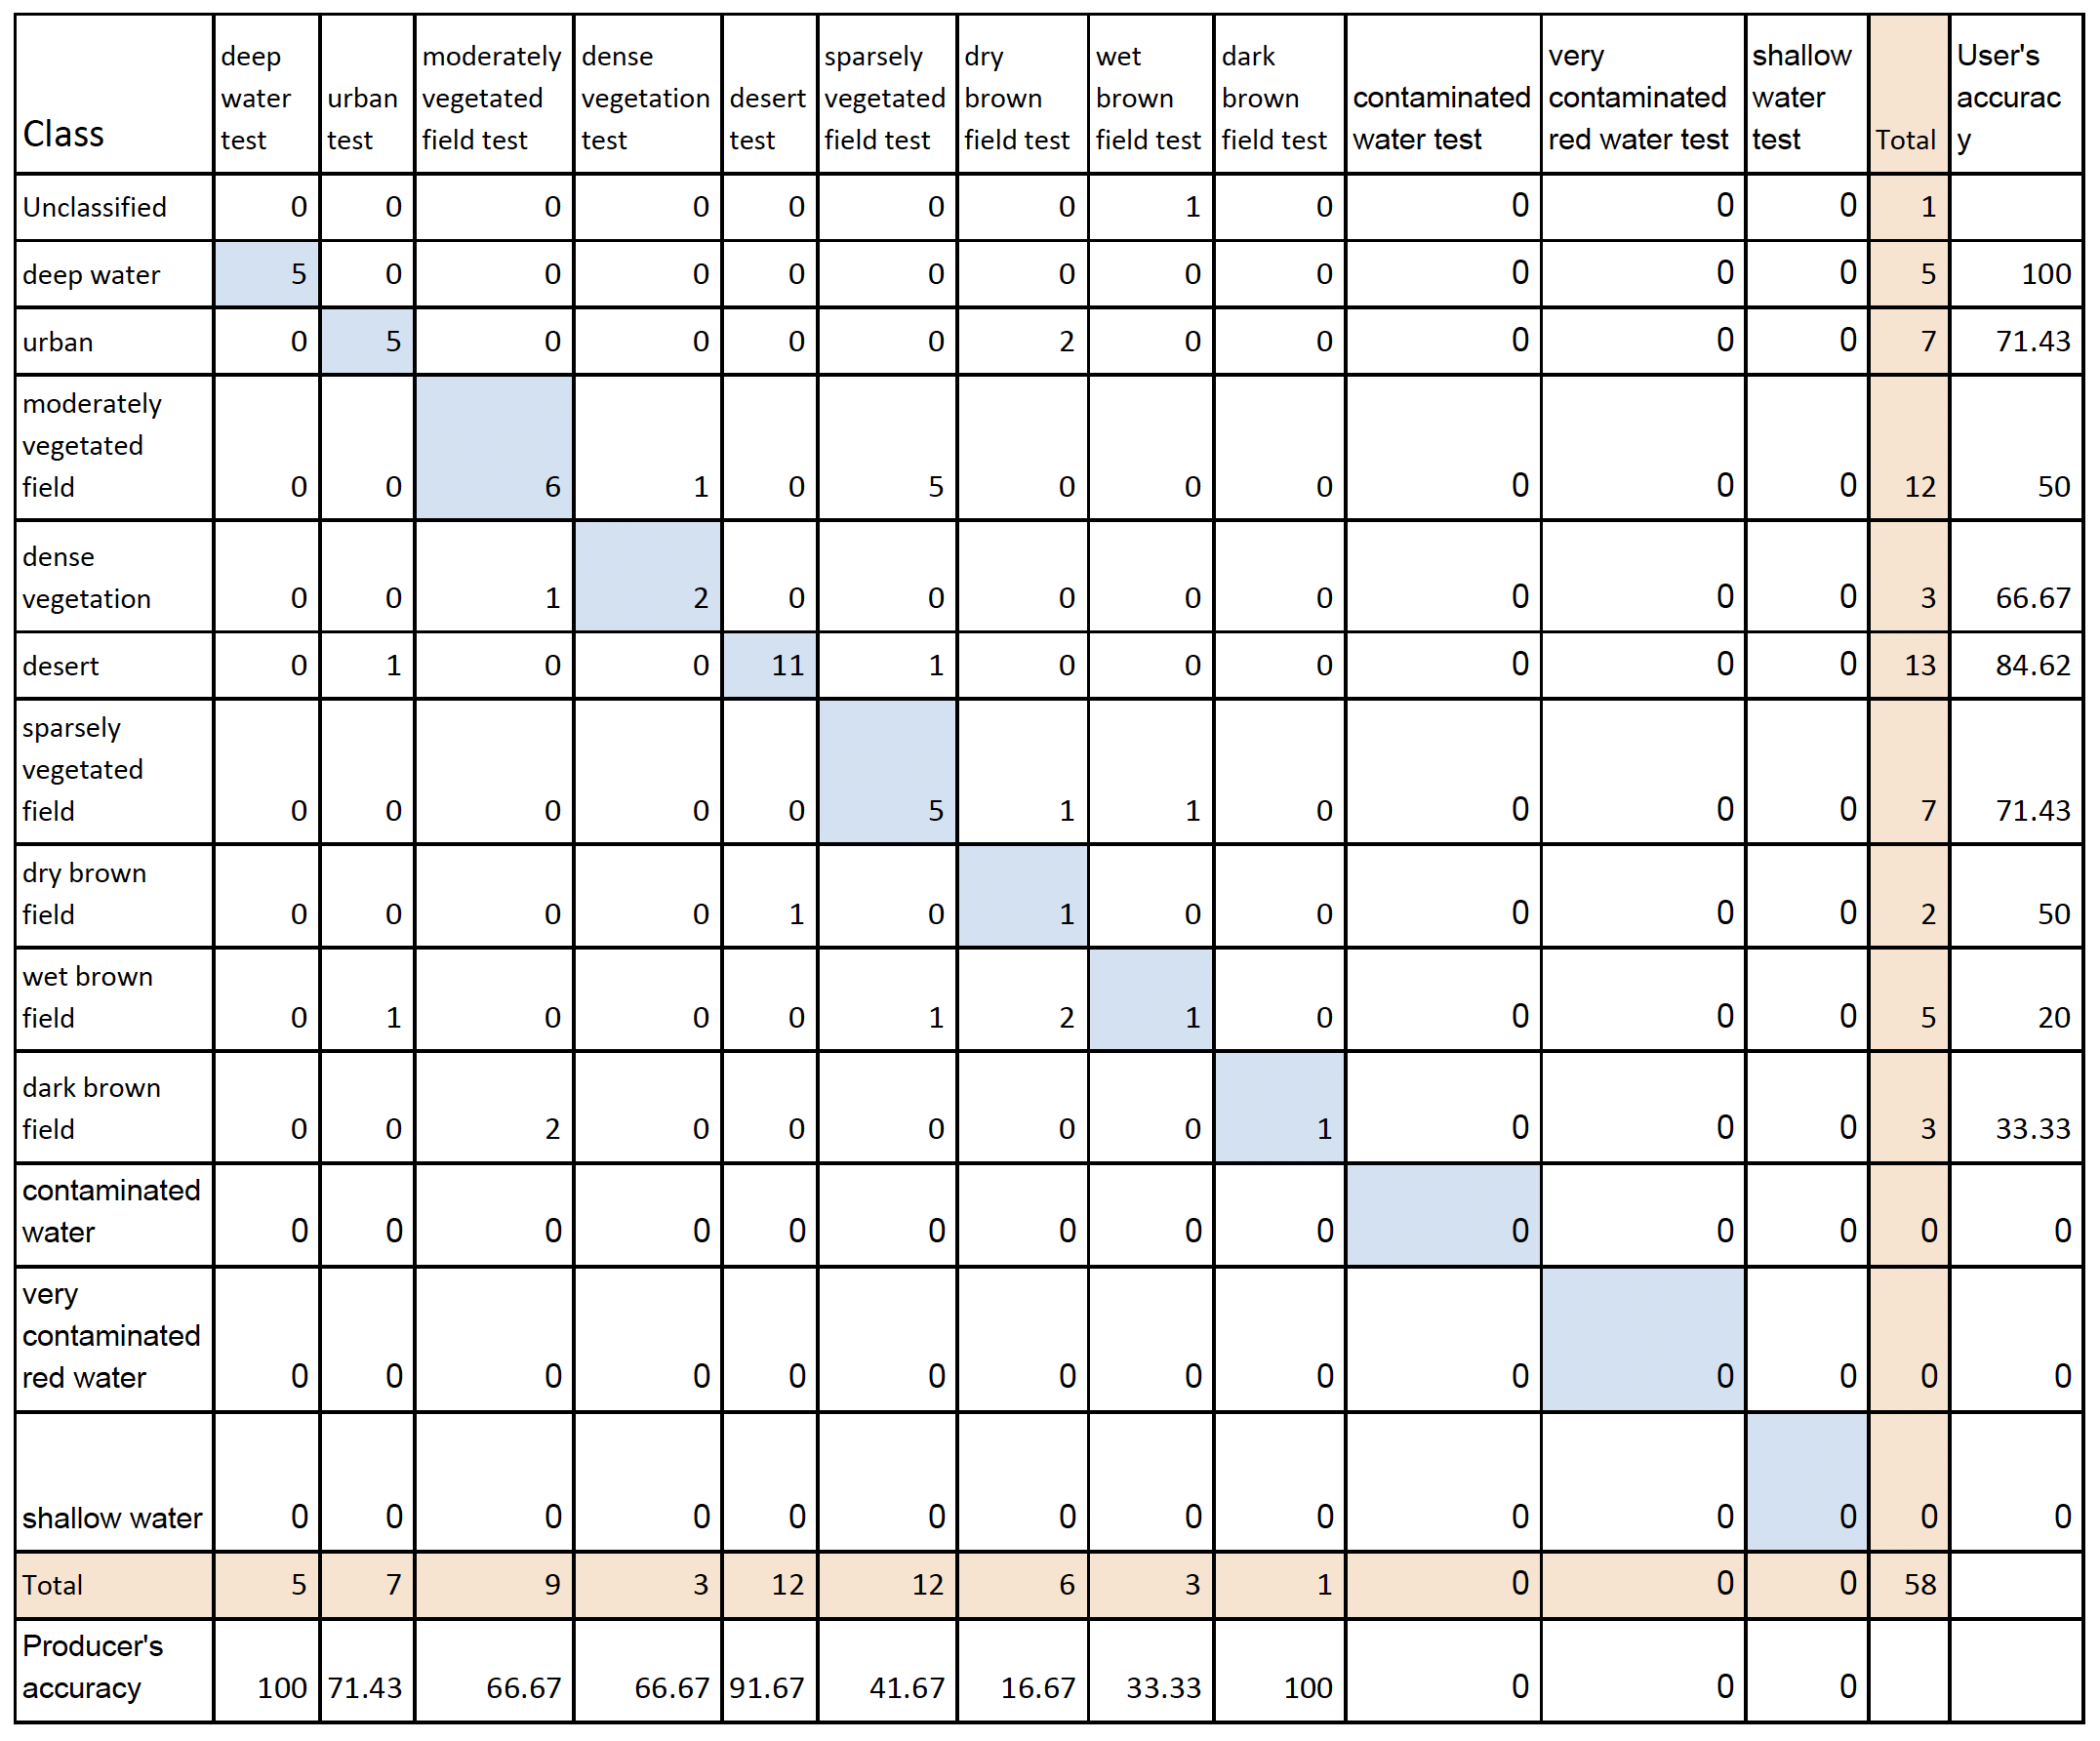
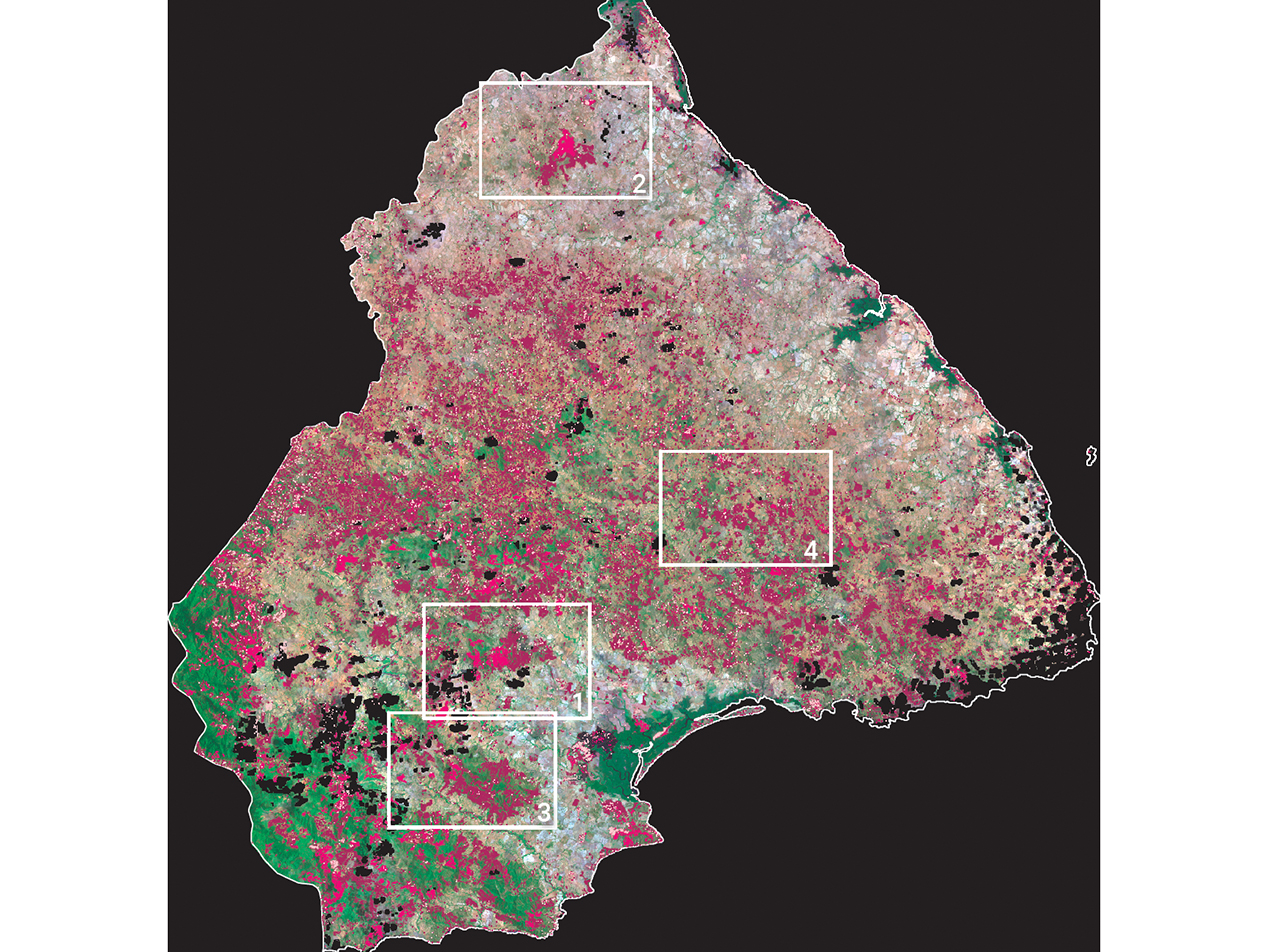
Satellite Image Classification (Egypt Agriculture)
Remote Sensing, Classification
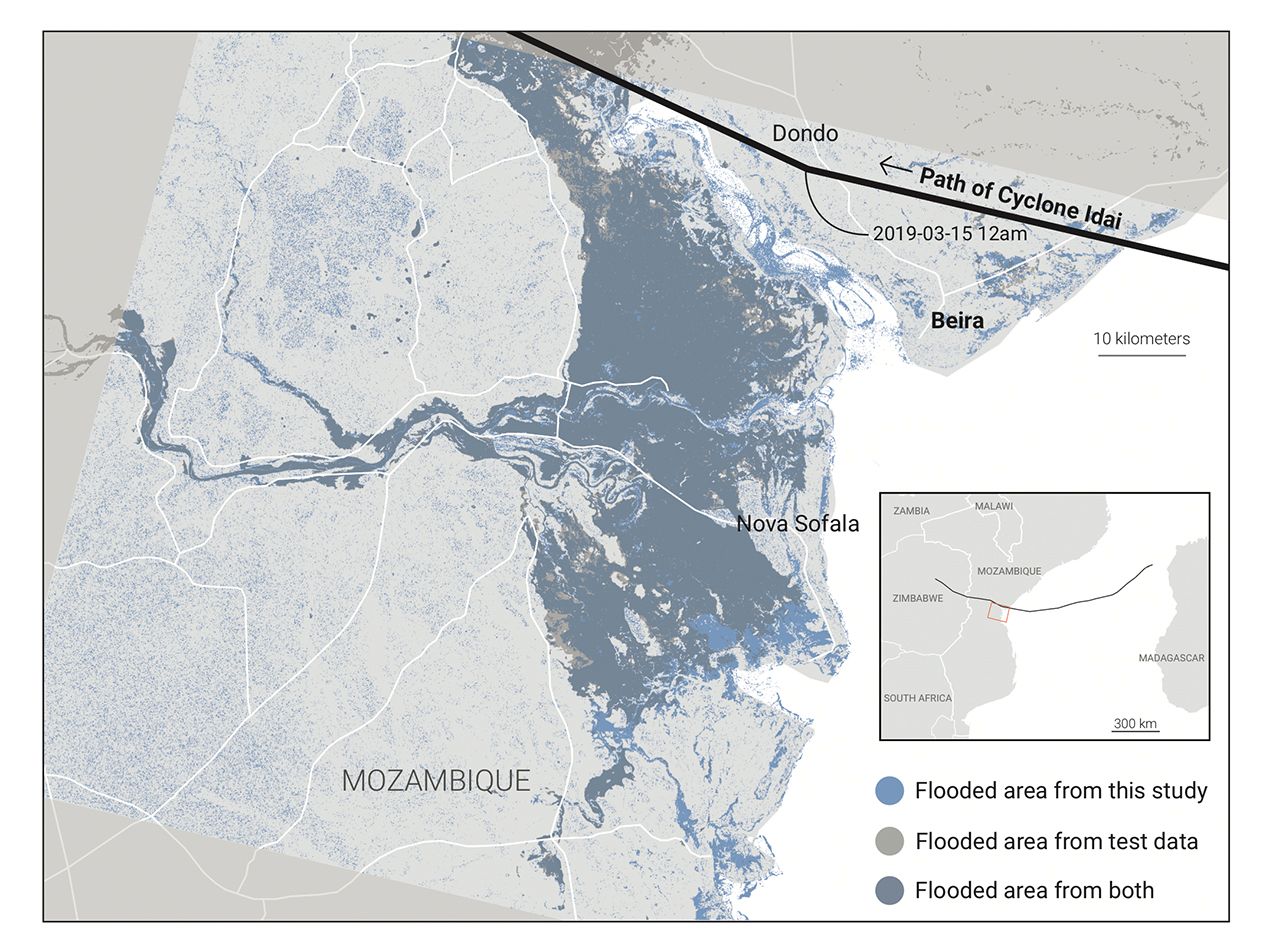
Remote sensing: Cyclone Idai Flood mapping
Remote sensing, Classification
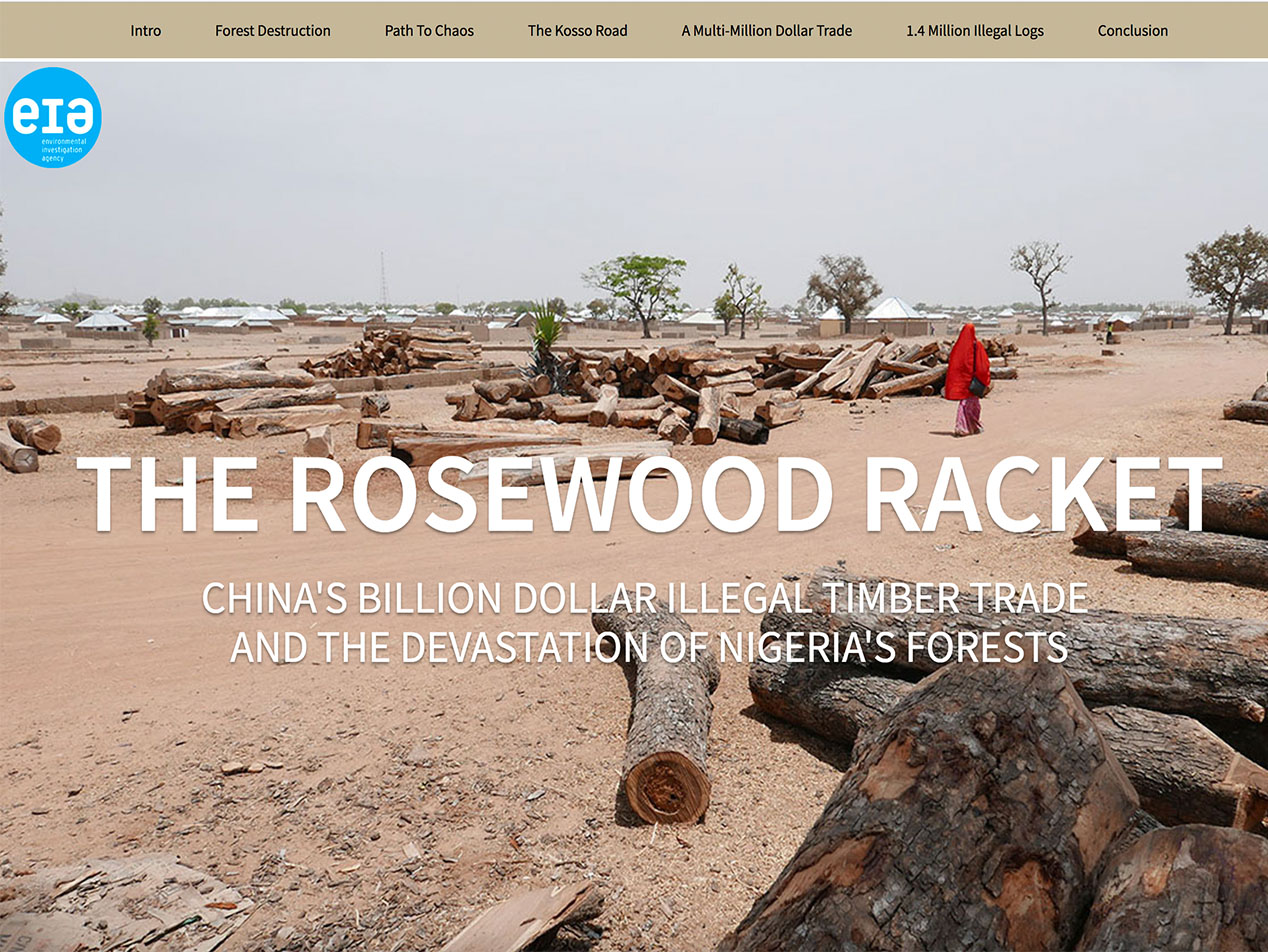
Interactive story: Nigeria's Kosso Trade
Interactive Storytelling
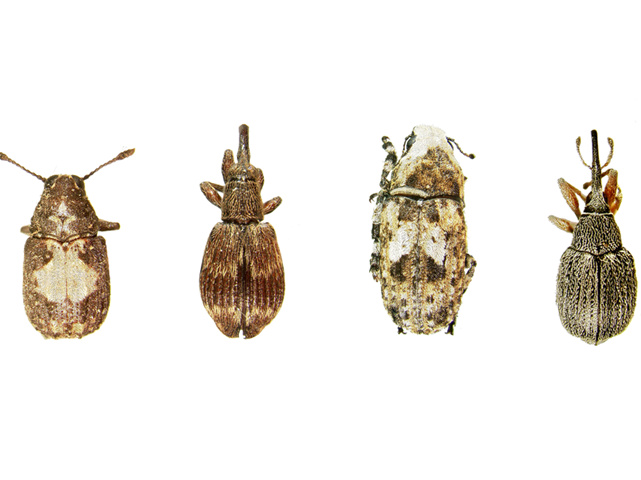
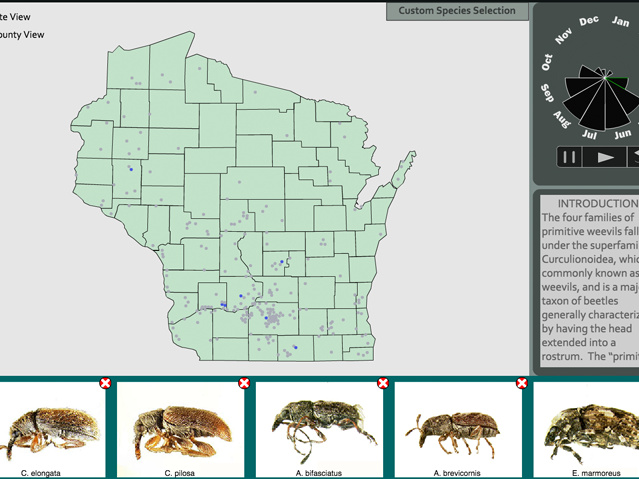
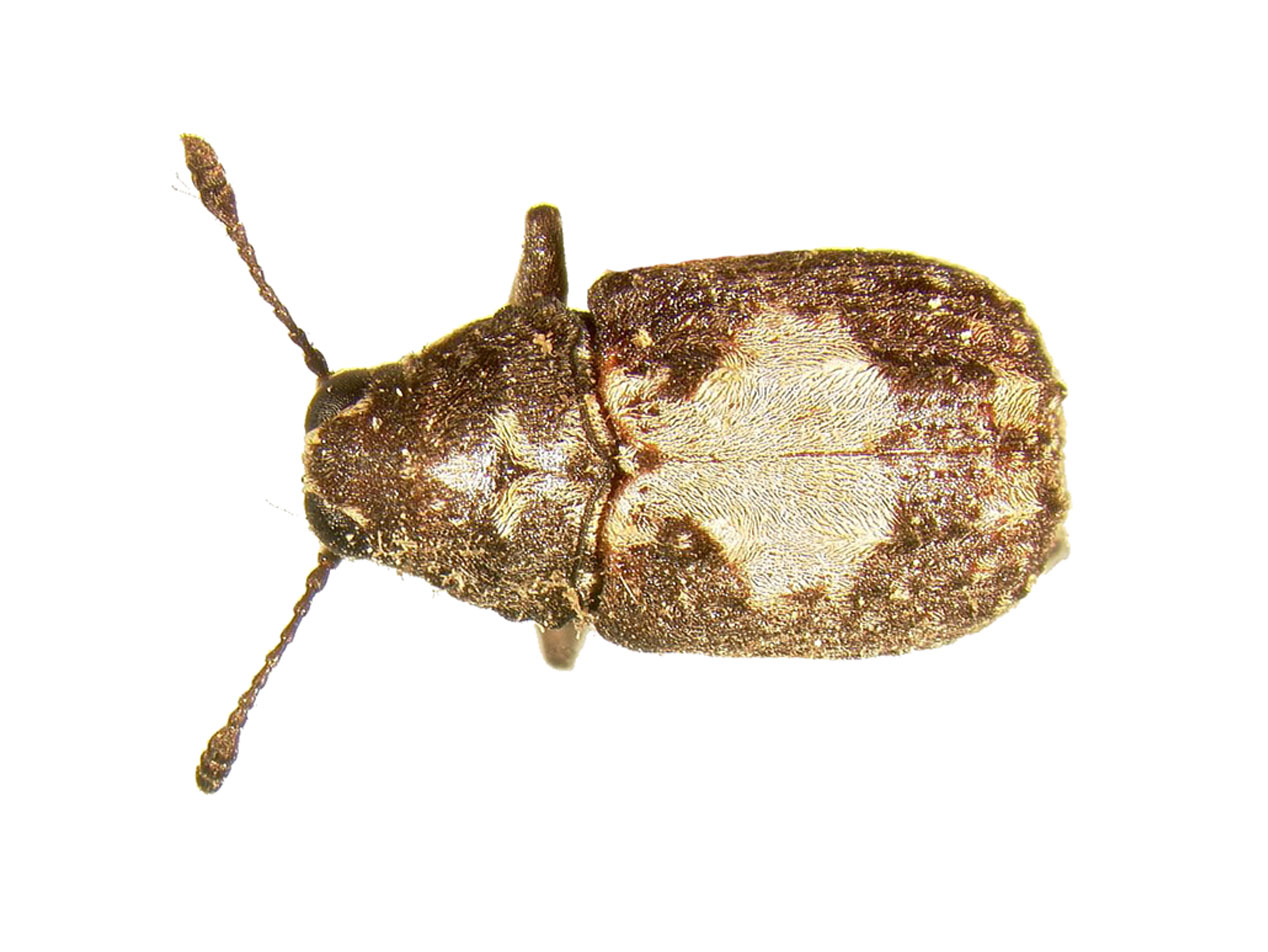
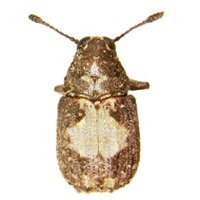
Primitive Weevils of Wisconsin
Taxonomy, Survey, Conservation
Selected reports I contributed to
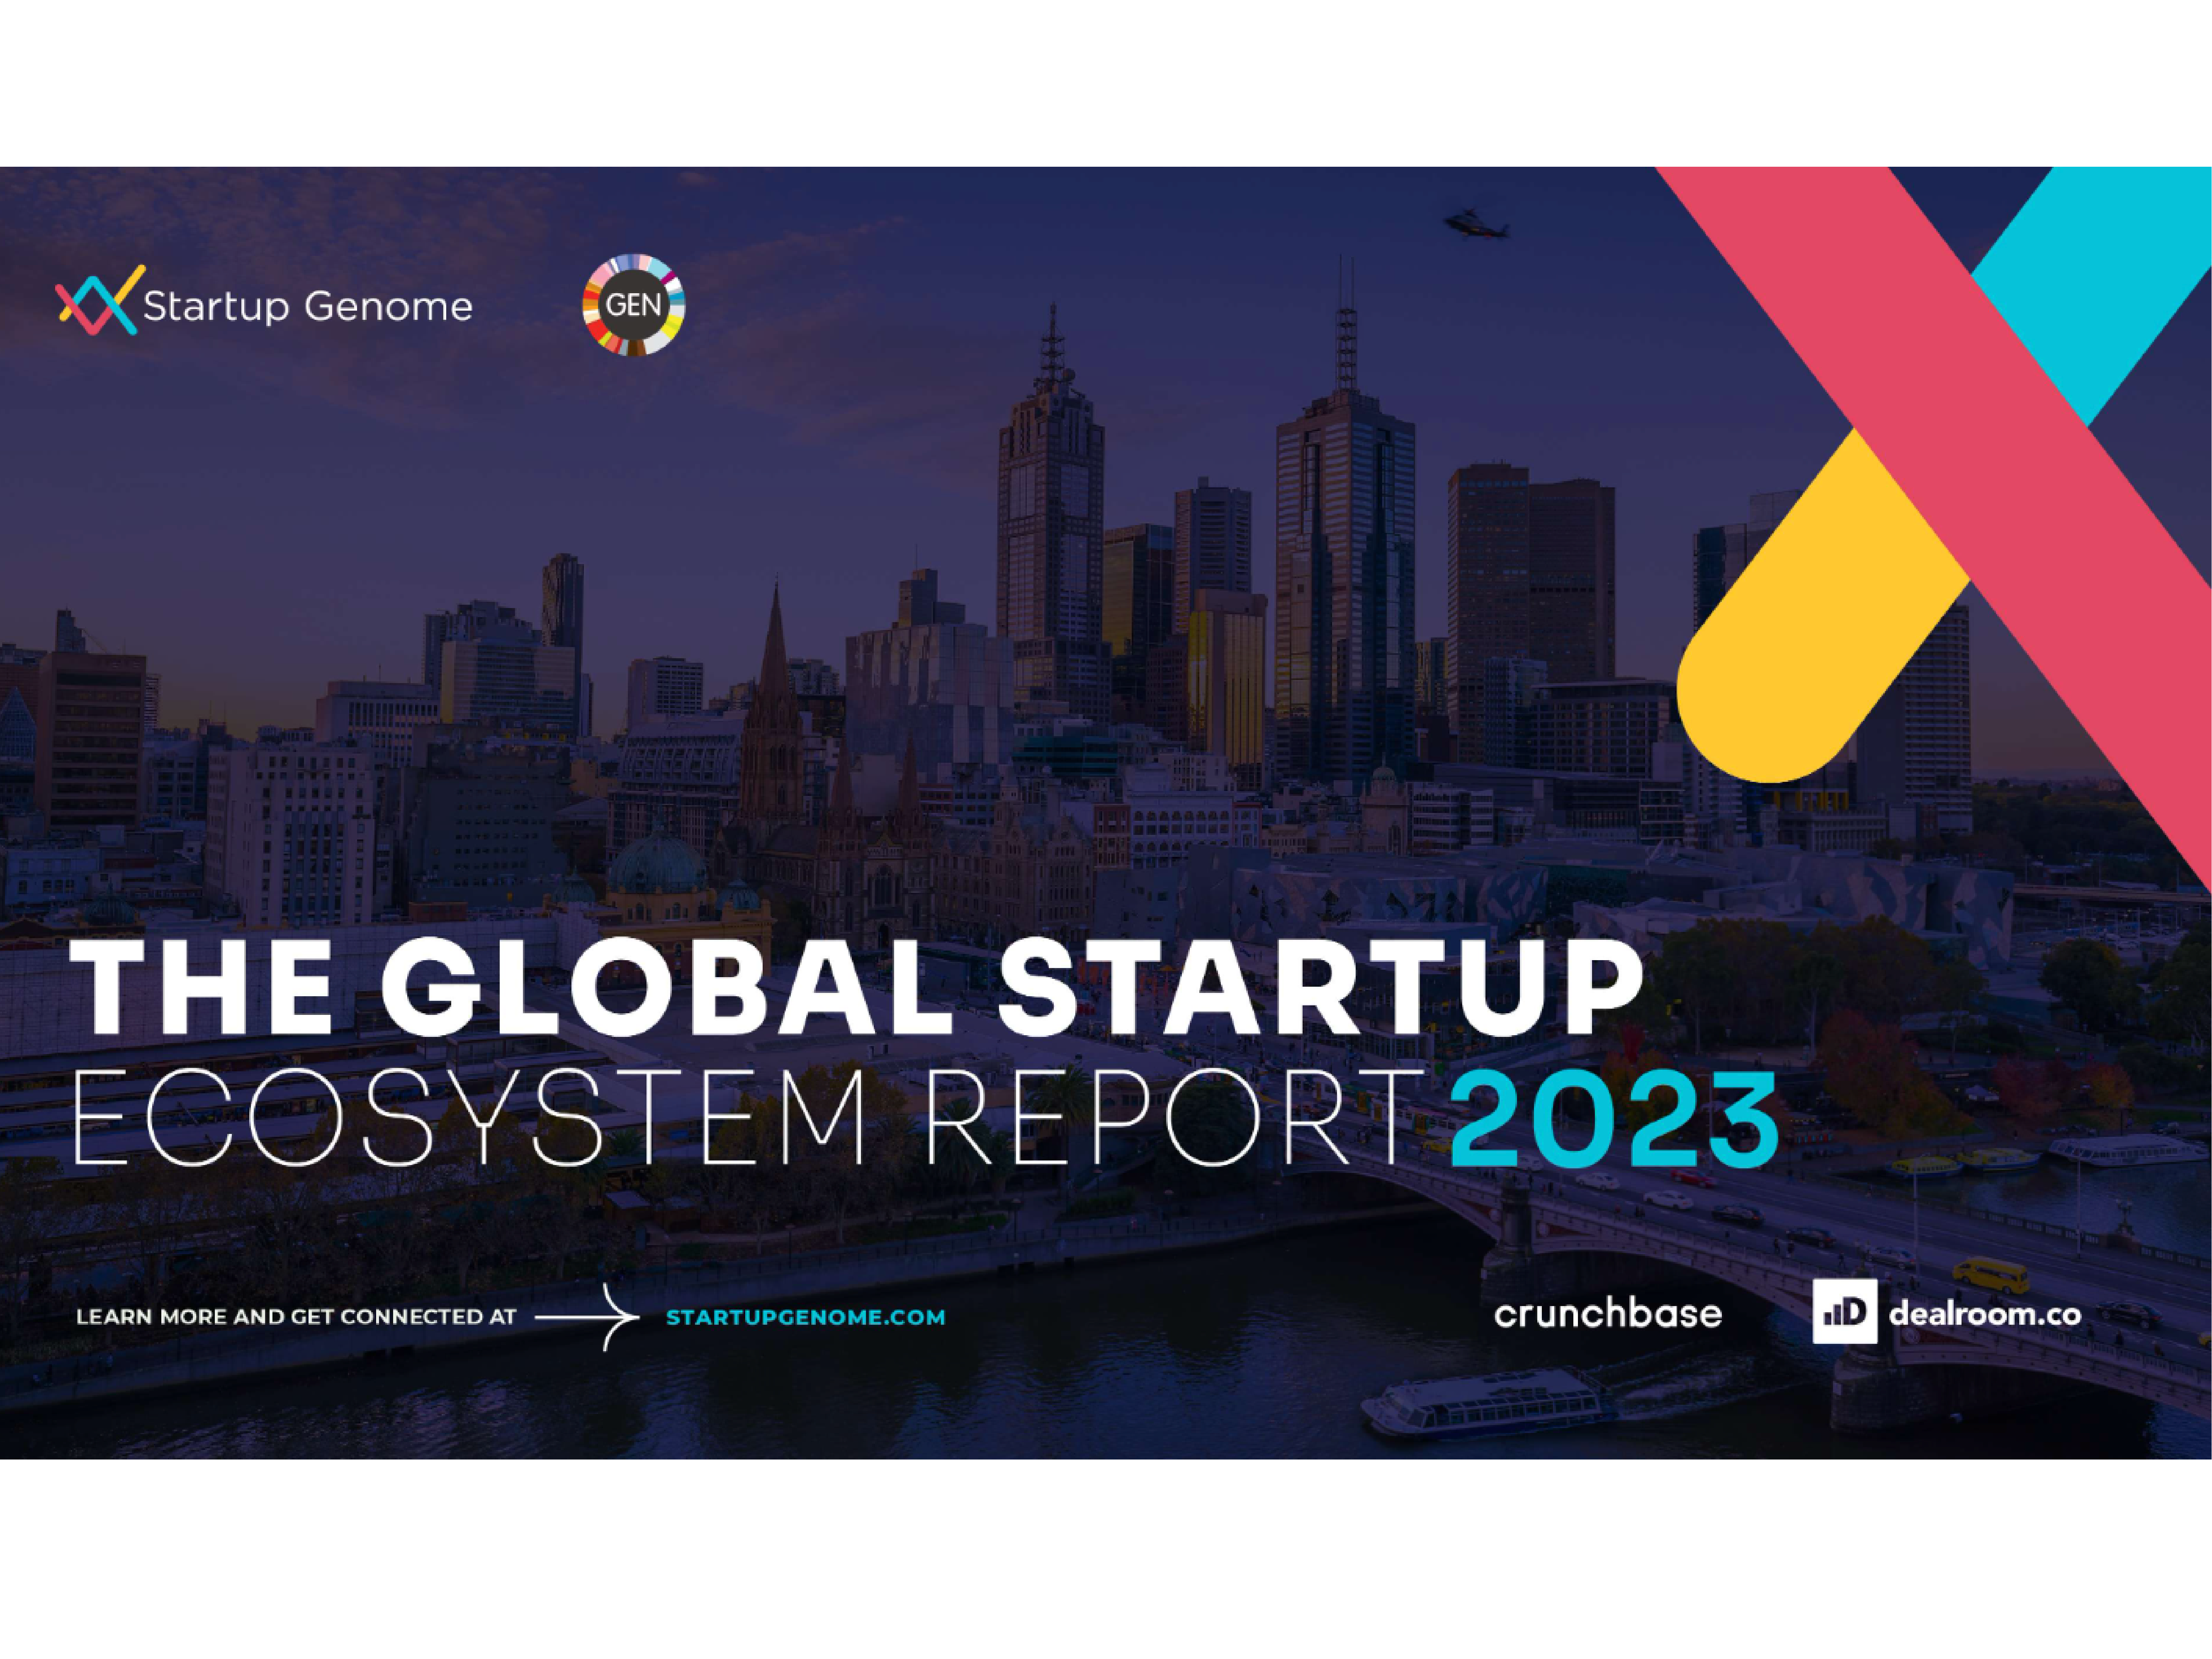
Global Startup Ecosystem Report 2023
Startup Genome
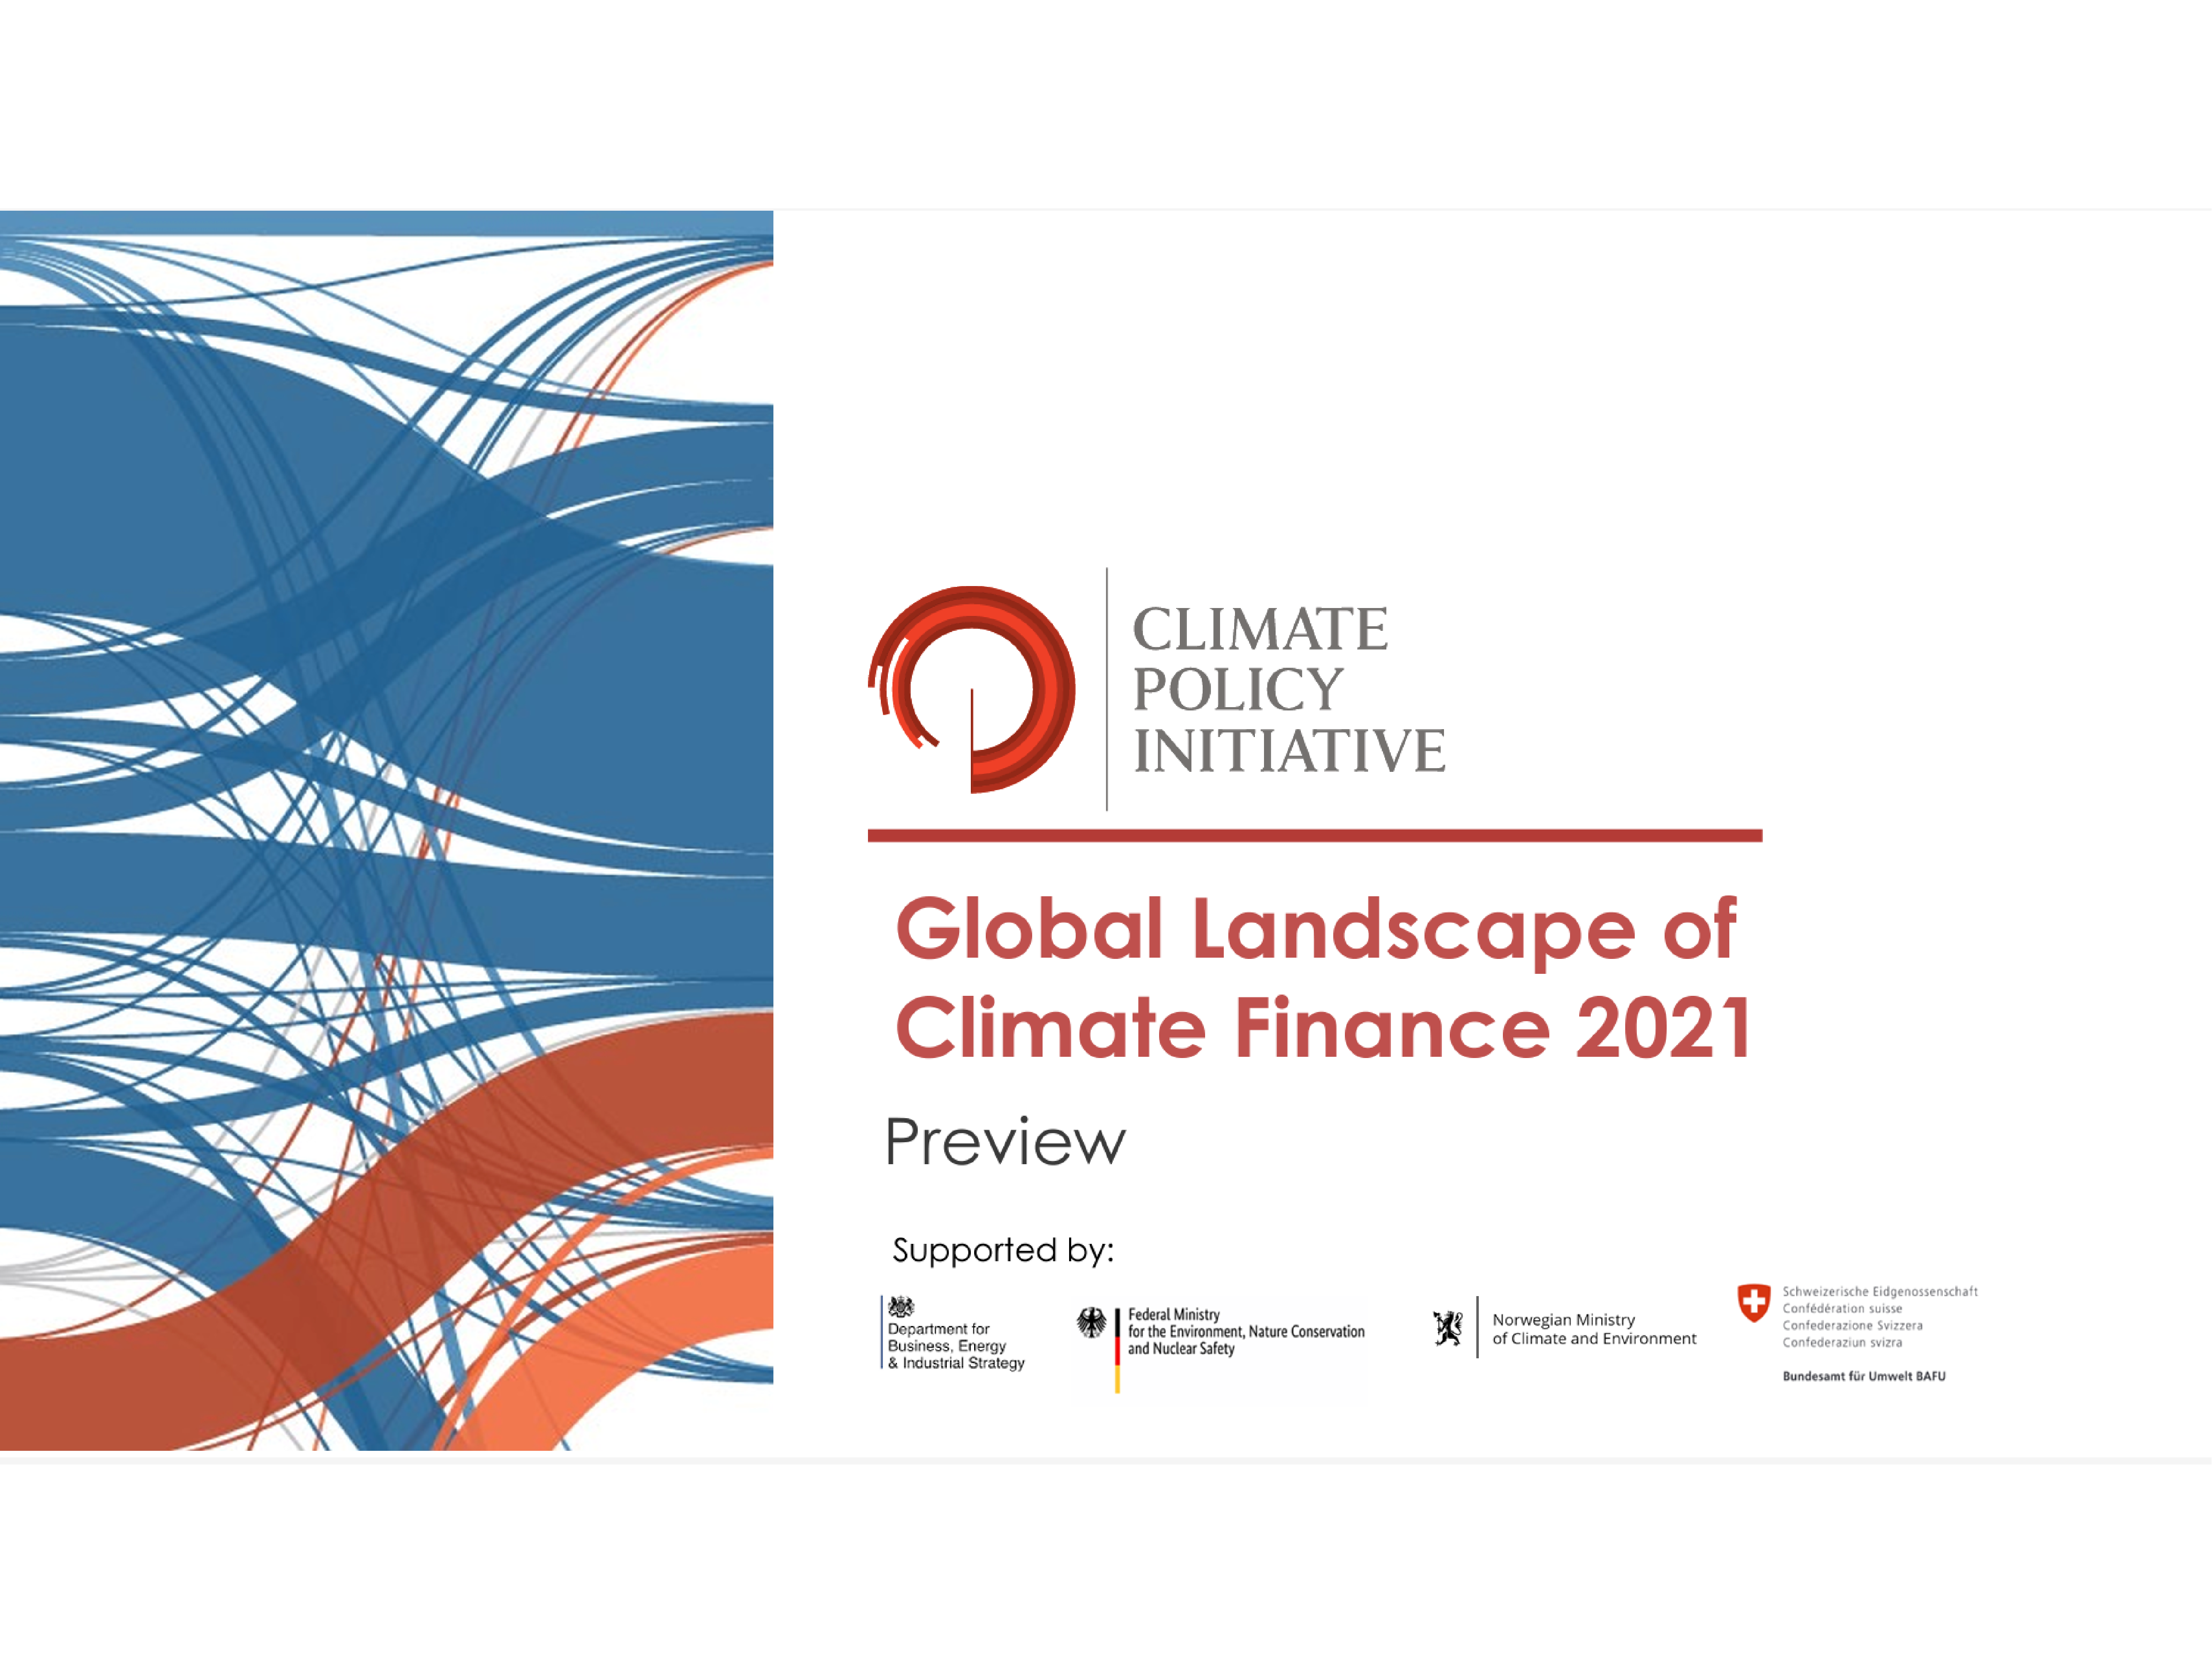
Global Landscape of Climate Finance 2021
Climate Policy Initiative
Data Matters 4
UNODC
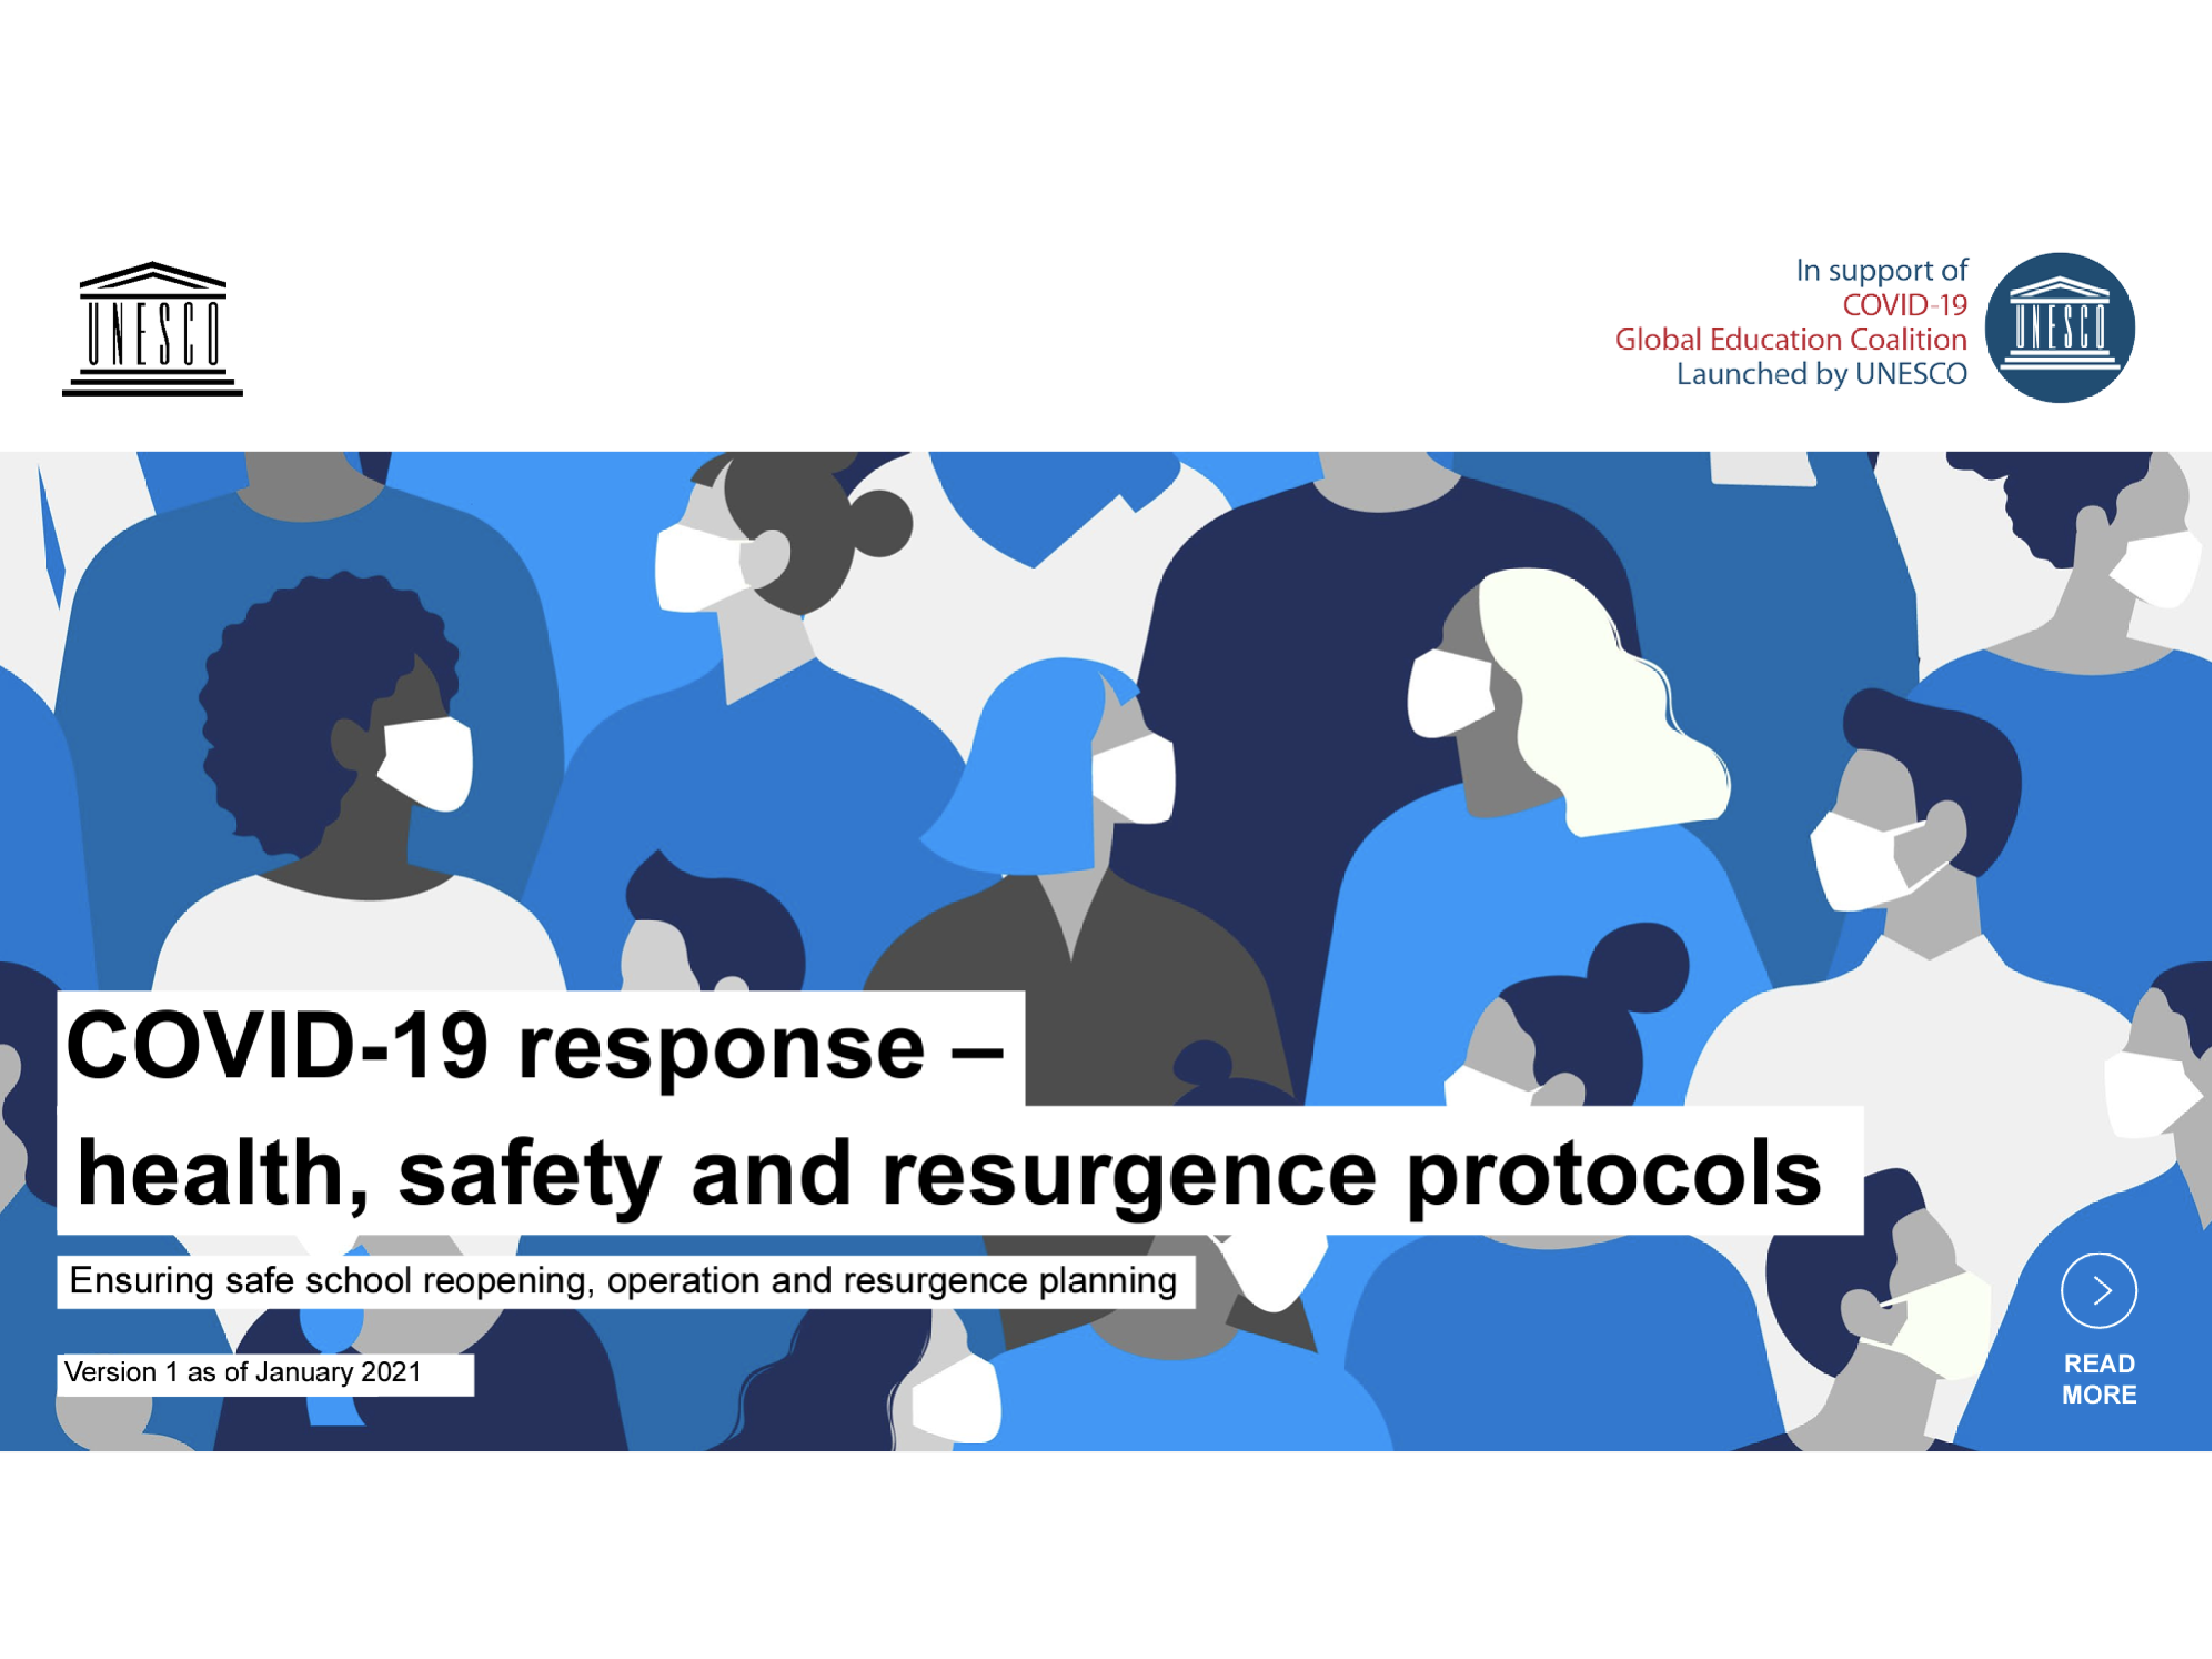
Covid-19 response toolkit
UNESCO
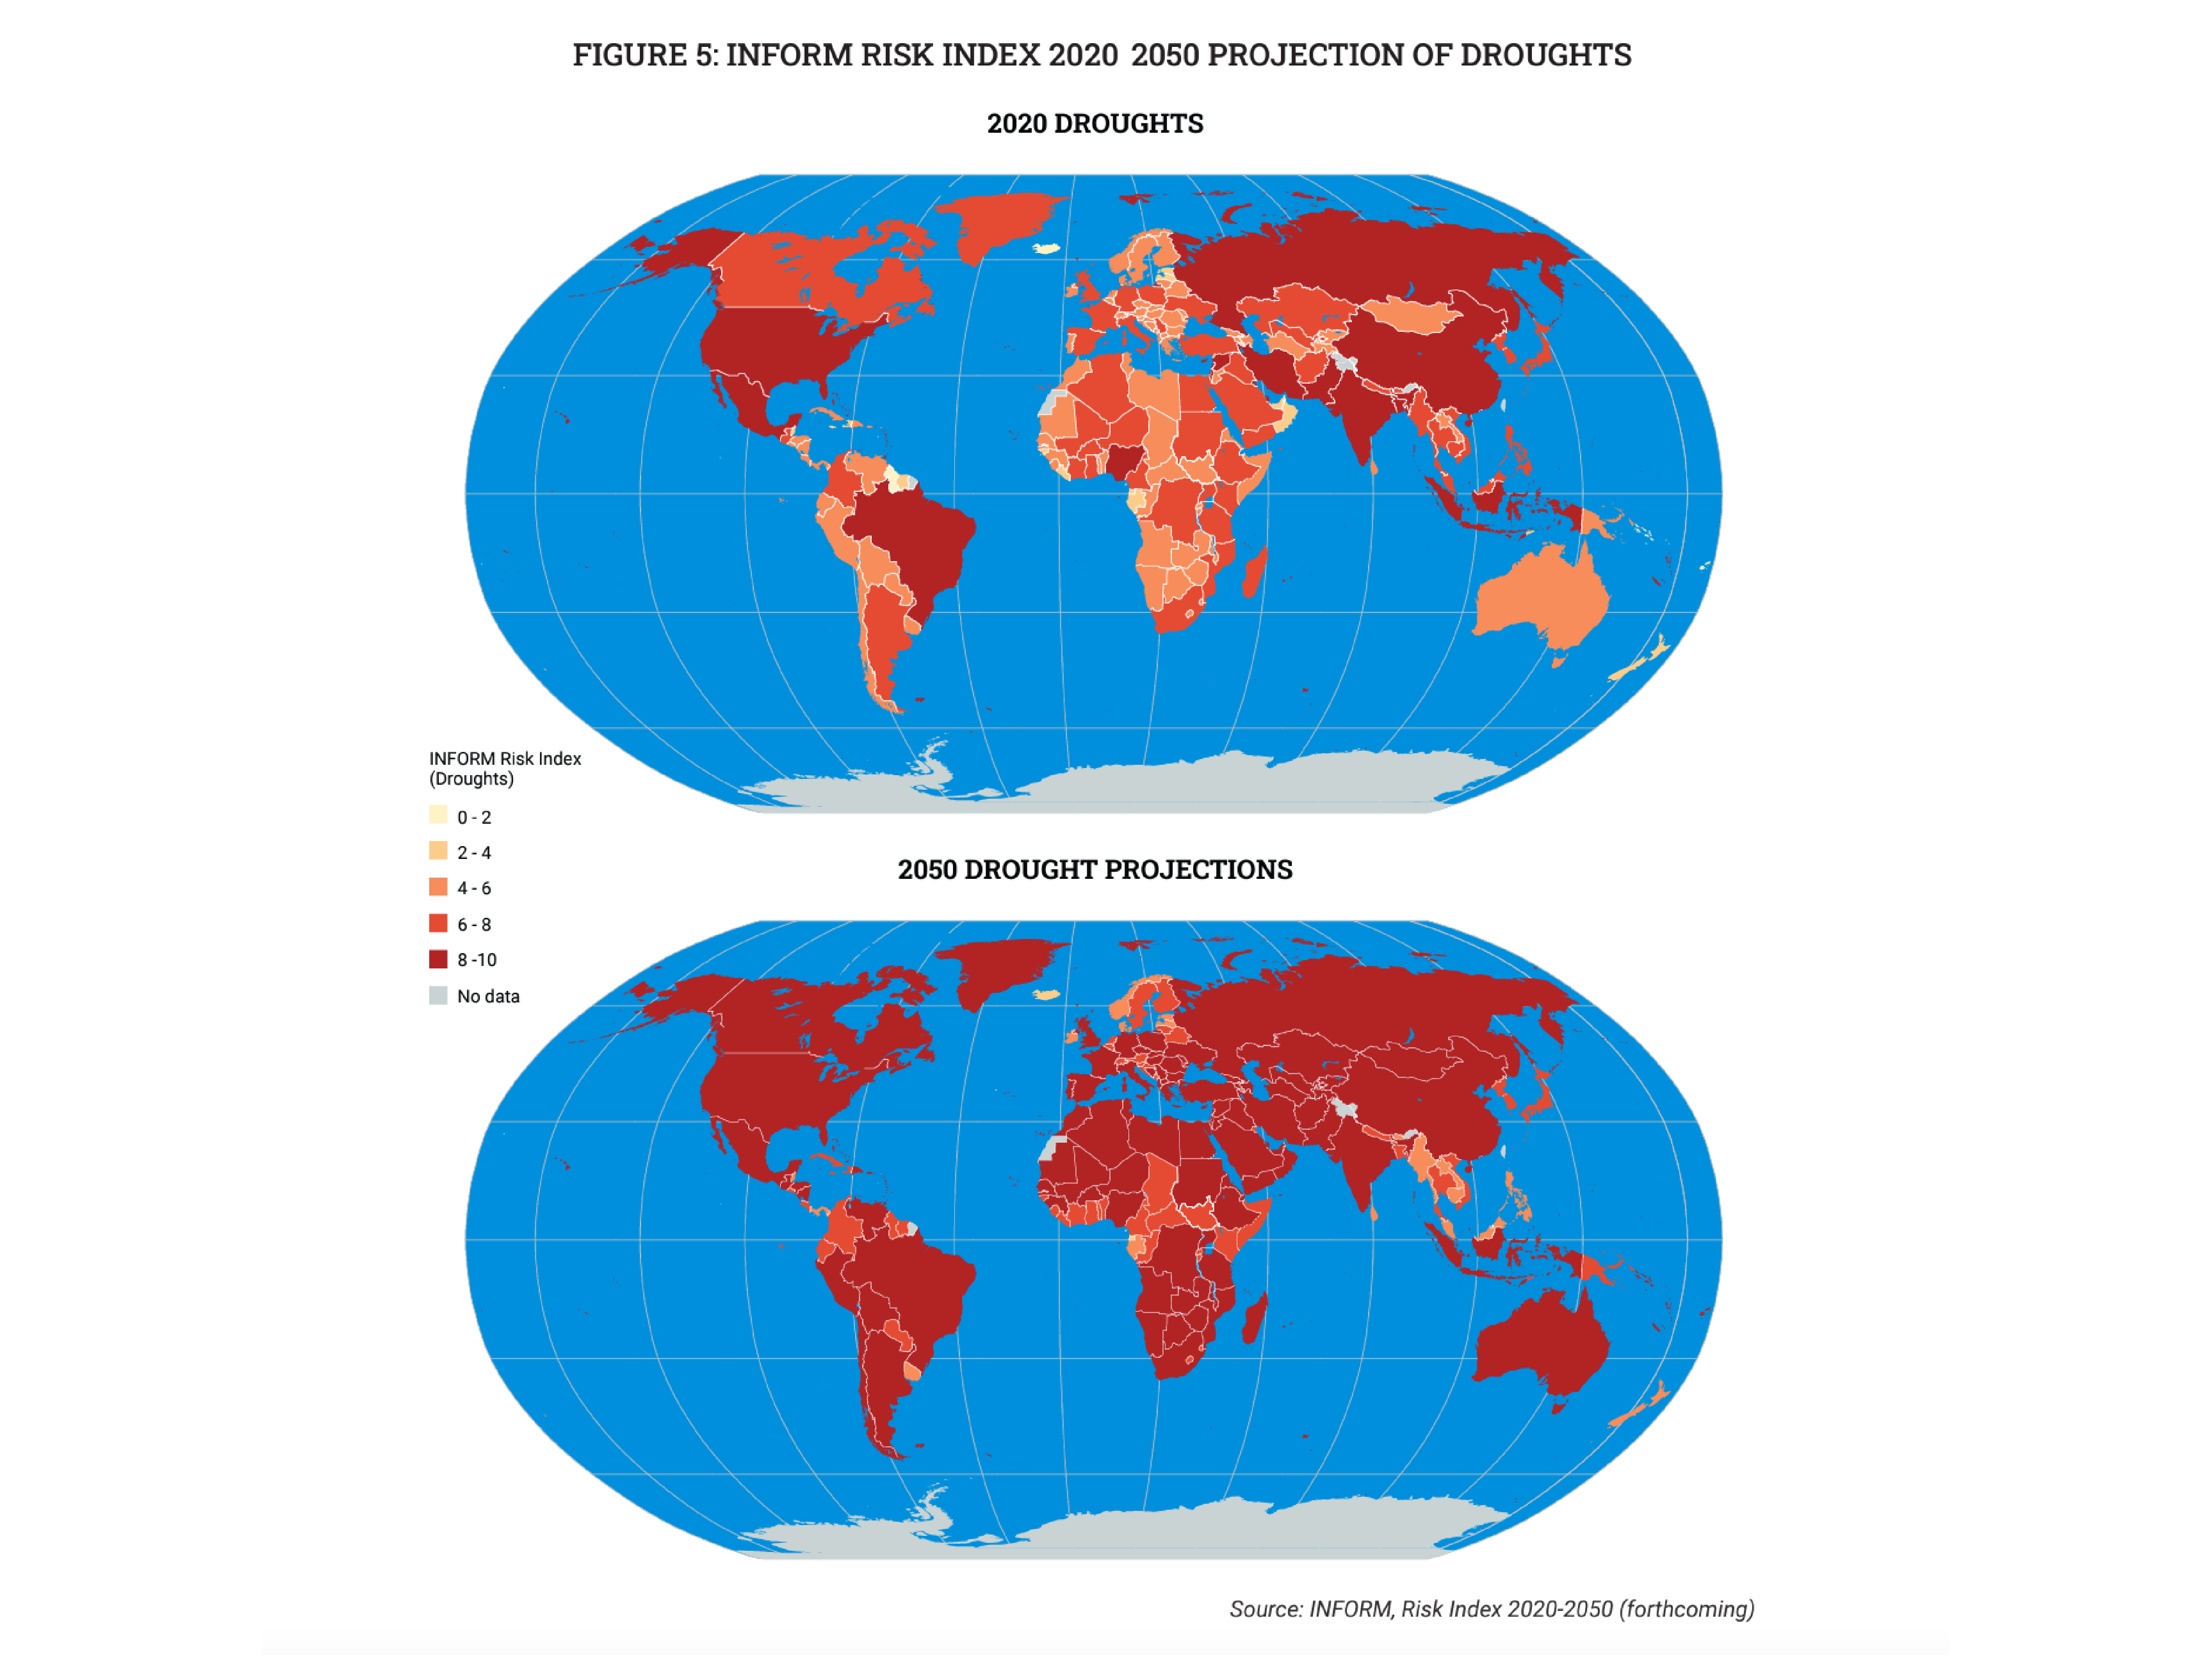
No Return to Normal: The Growing Humanitarian Climate Emergency
UN-OCHA
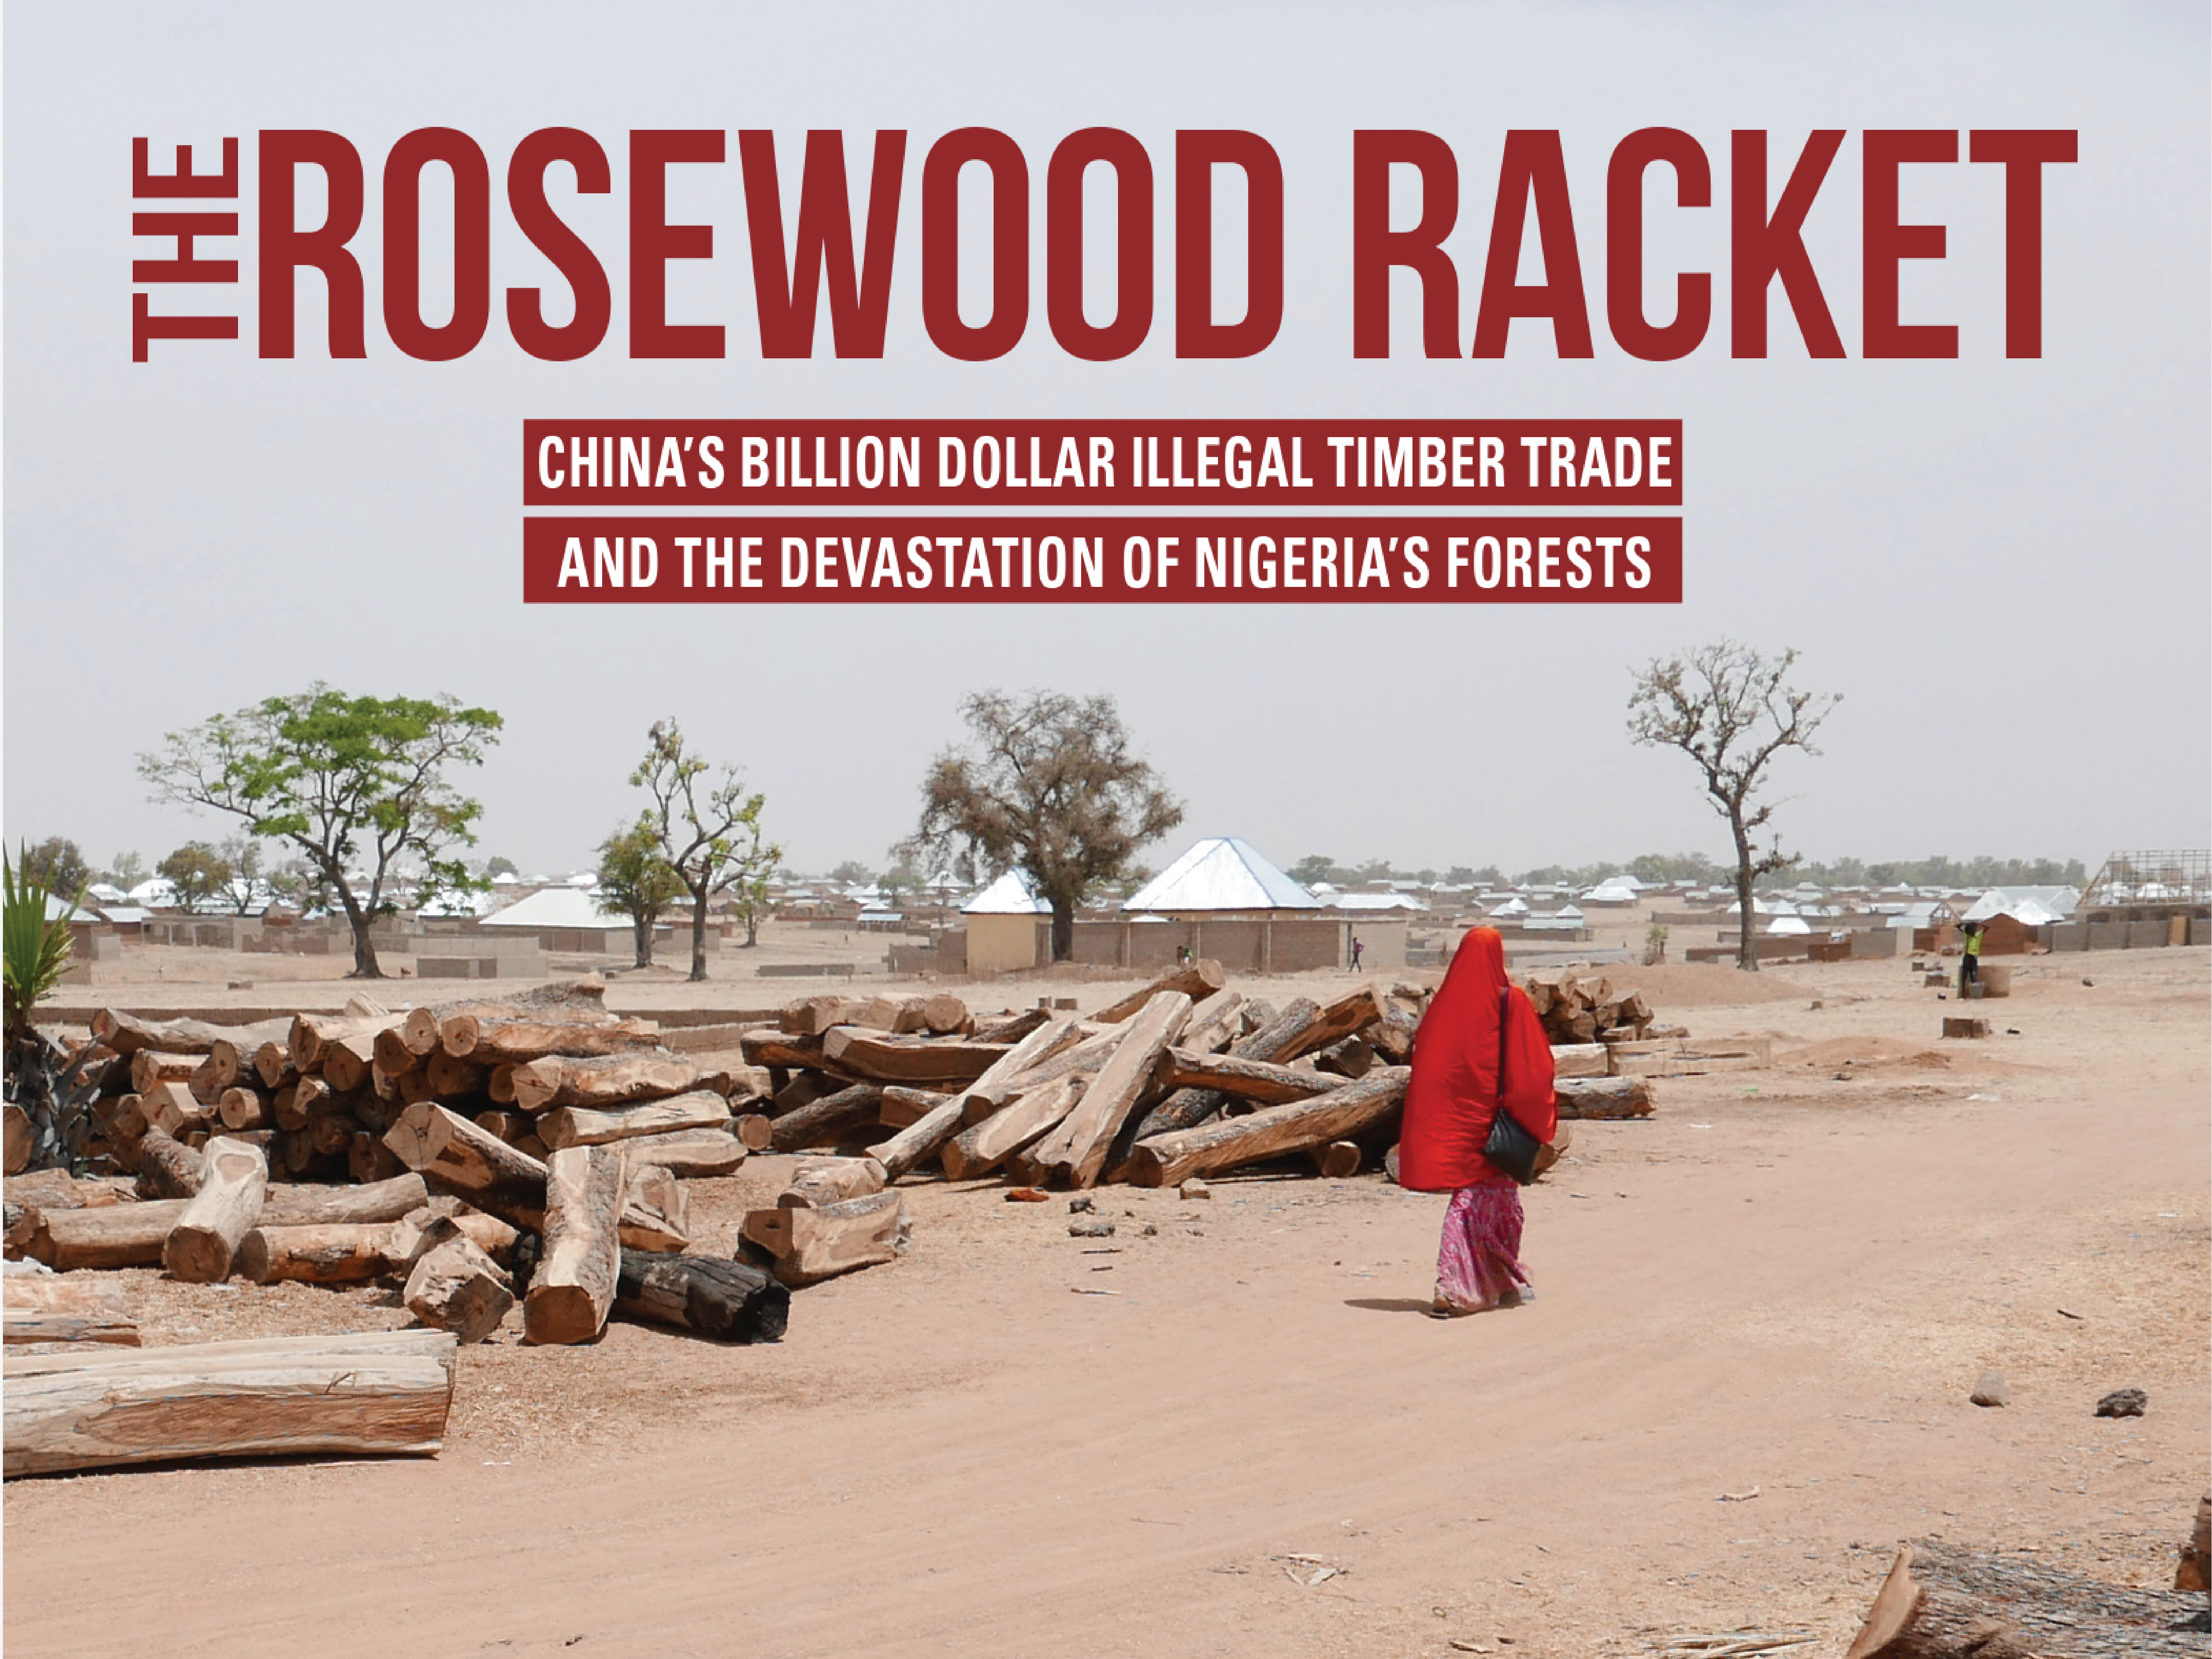
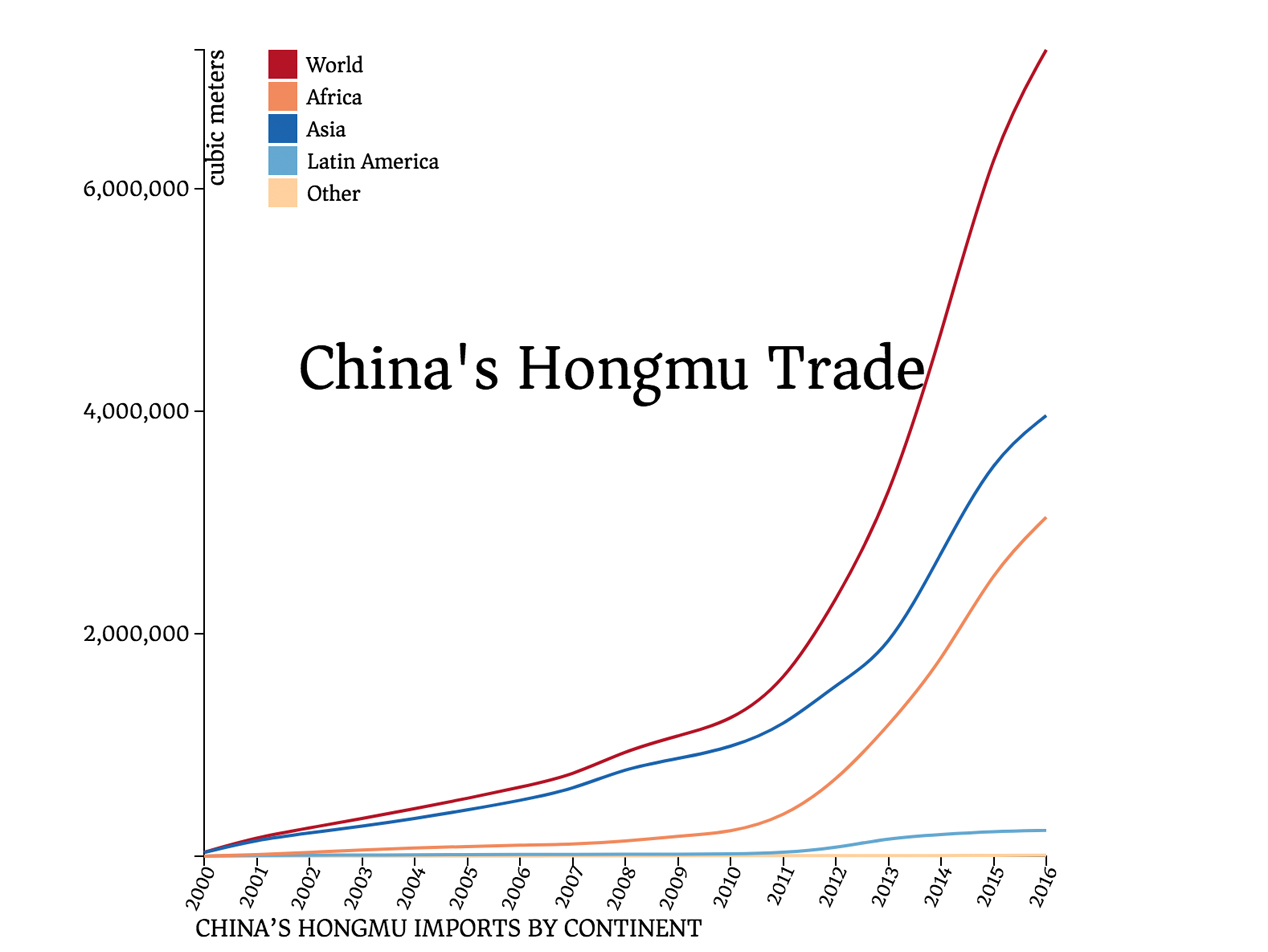
The Rosewood Racket
Environmental Investigation Agency
Some things I do
Data Visualization & Data Journalism
I enjoy finding insights from data and telling stories.
I use D3 for a
lot of my work
along with many other tools such as R,
python, QGIS, and recently
also D3 +
Svelte.
Some of my
more
notable work include the biodiversity series I worked on with Reuters Graphics,
which won the
SND 44'th edition world's best design in digital and also 2nd place for the SEJ 22nd Annual Awards for
Reporting on the Environment.
I also started a platform, The
Tardigrade, to
use data-driven interactive
stories to raise awareness for different species. A story on sharks made it to the
IIBA
2019 Shortlist. Then I started another project Taiwan
Data Stories with Daisy Chung to show some interesting data-driven / visual aspects
of Taiwanese culture. The boba story won the Pudding Cup 2022,
and three got
long-listed at IIBA. Our other vaccine story got
short-listed.
I try to document my process when I can, see my personal github
page and TDS github page
Conservation & Environmental Sciences
A lot of my work is motivated by biodiversity / environmental conservation. I have conducted research on topics such as beetle taxonomy, illegal wildlife trade, and burned-area mapping for reforestation.
In 2019, I received the Cocos Island Conservation Scholarship from Turtle Island Restoration Network to go on a diving trip to Cocos island to assist the science team.
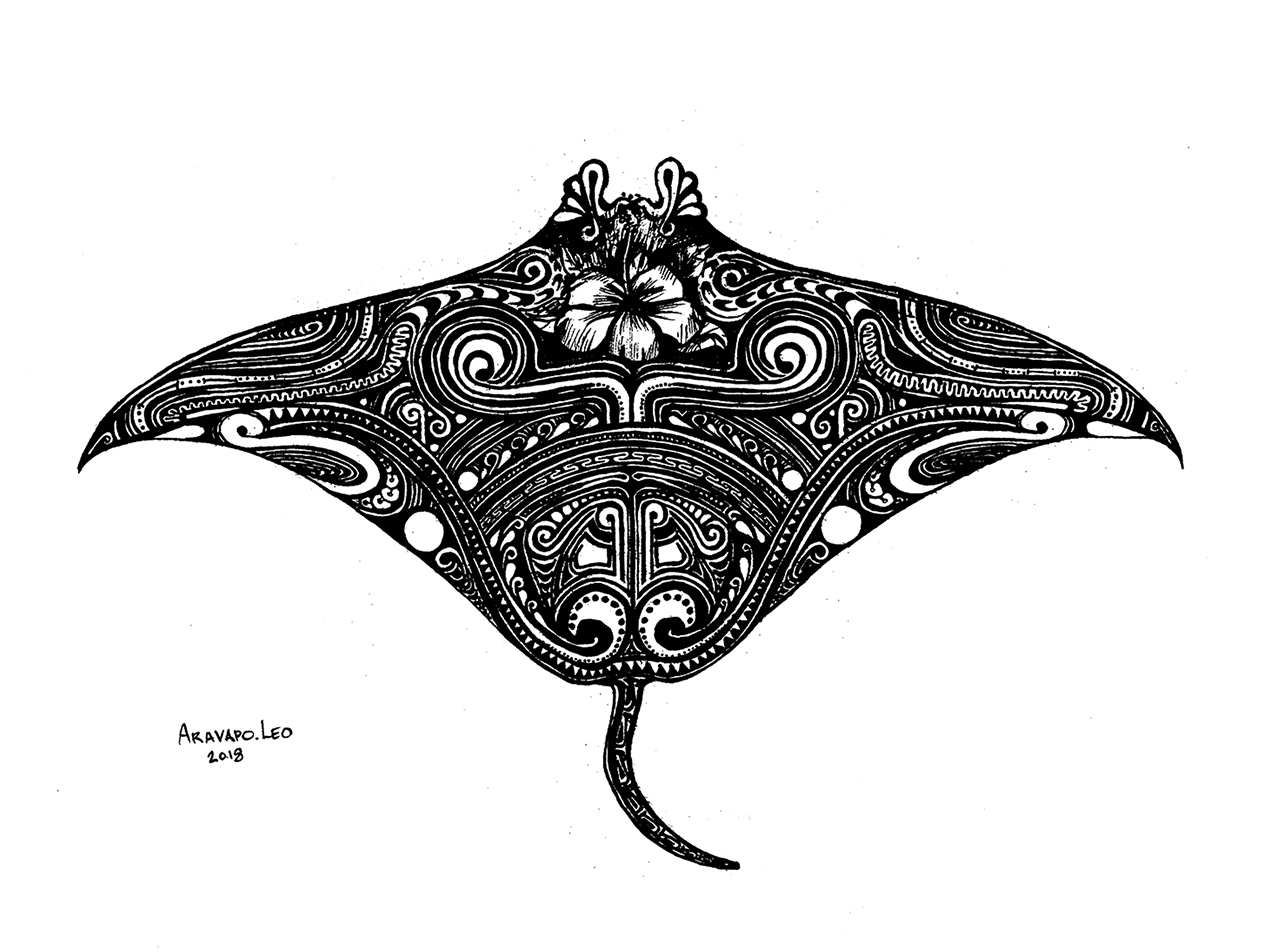
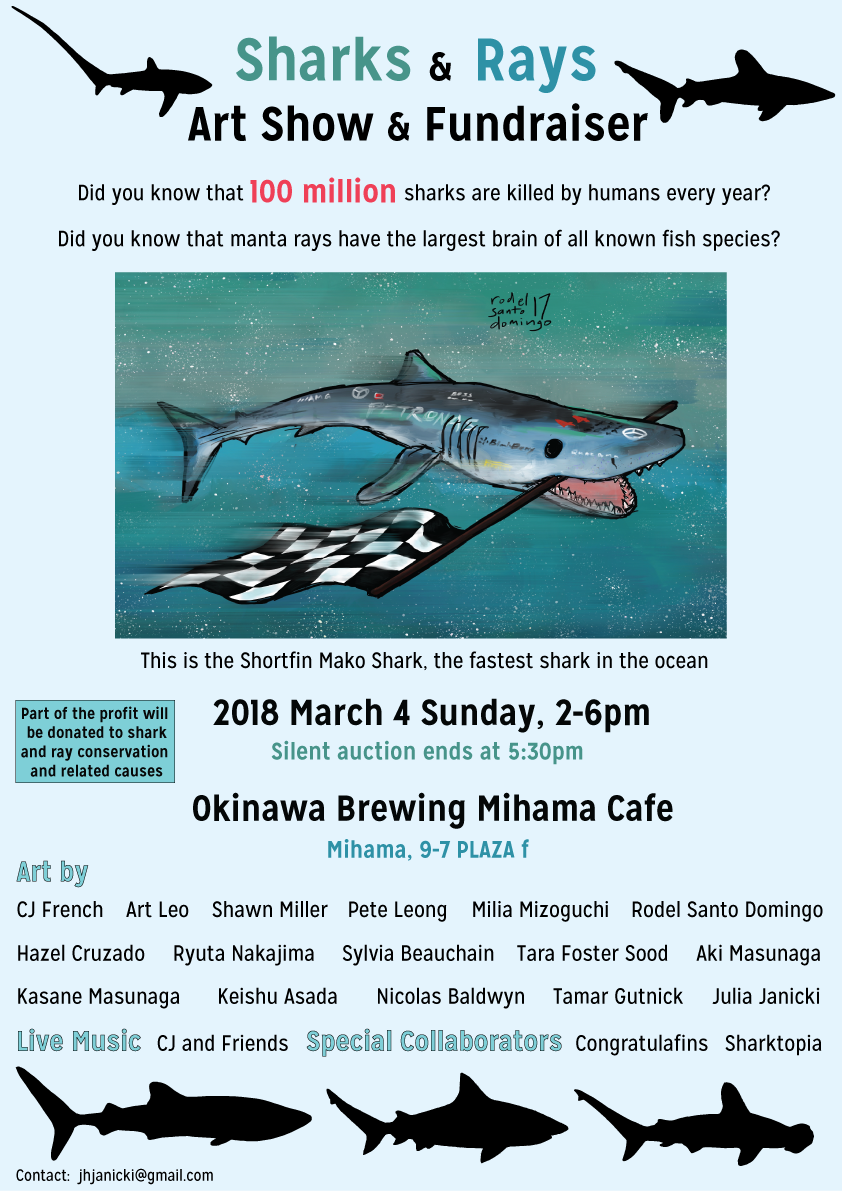
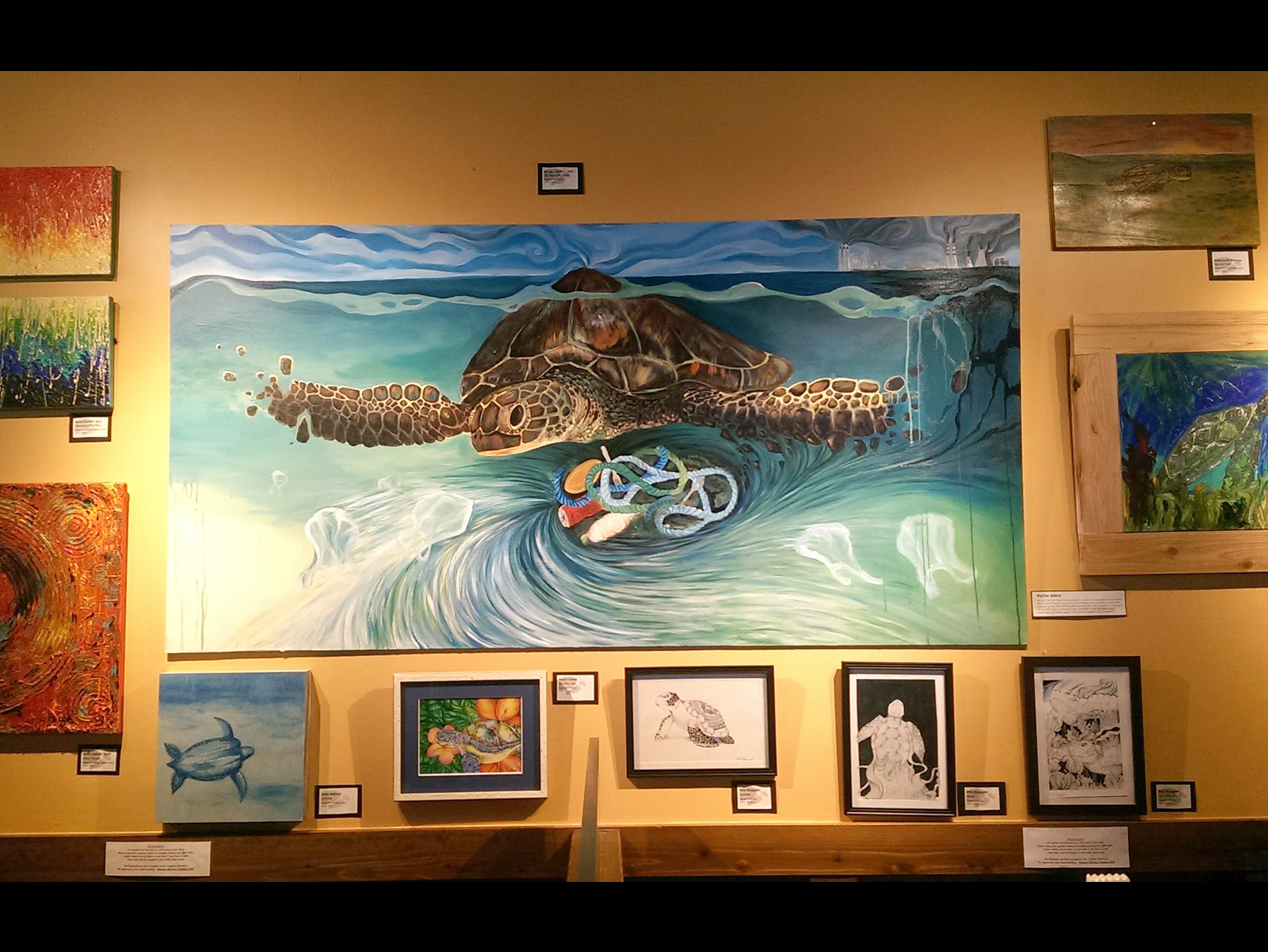
I have also done a lot of environmental outreach for educational purposes. I received a grant from the US Department of State and started the Educational Artshow Fundraiser series in Okinawa. I also enjoy creating educational pieces to raise awareness for environmental issues, such as Parrot Plights: The Pet Trade & Habitat Loss for The Tardigrade.
Maps & exploratory / geovisualization tools
I have taken many cartography courses at UW-Madison (the whole
curriculum) and often
work on many static and interactive mapping projects, some of which are exploratory tools, such
as antmaps.org and the illegal otter
seizure map , some for scietists, some for activism / education, others for policy
makers.
I also created many maps using Mapbox for China Dialogue to
accompany their articles, such as one on the hydro
power plants in Latin America.
In 2019, I received my second M.S. in Environmental Observation &
Informatics, where I did a lot of spatial analysis using GIS and remote sensing
for various purposes, such as classifying satellimate images and conducting change detection,
more specifically I've classified palm oil plantations, mapped floods, mapped burned areas,
detected individual houses, and mapped urban areas.
Science & Tech
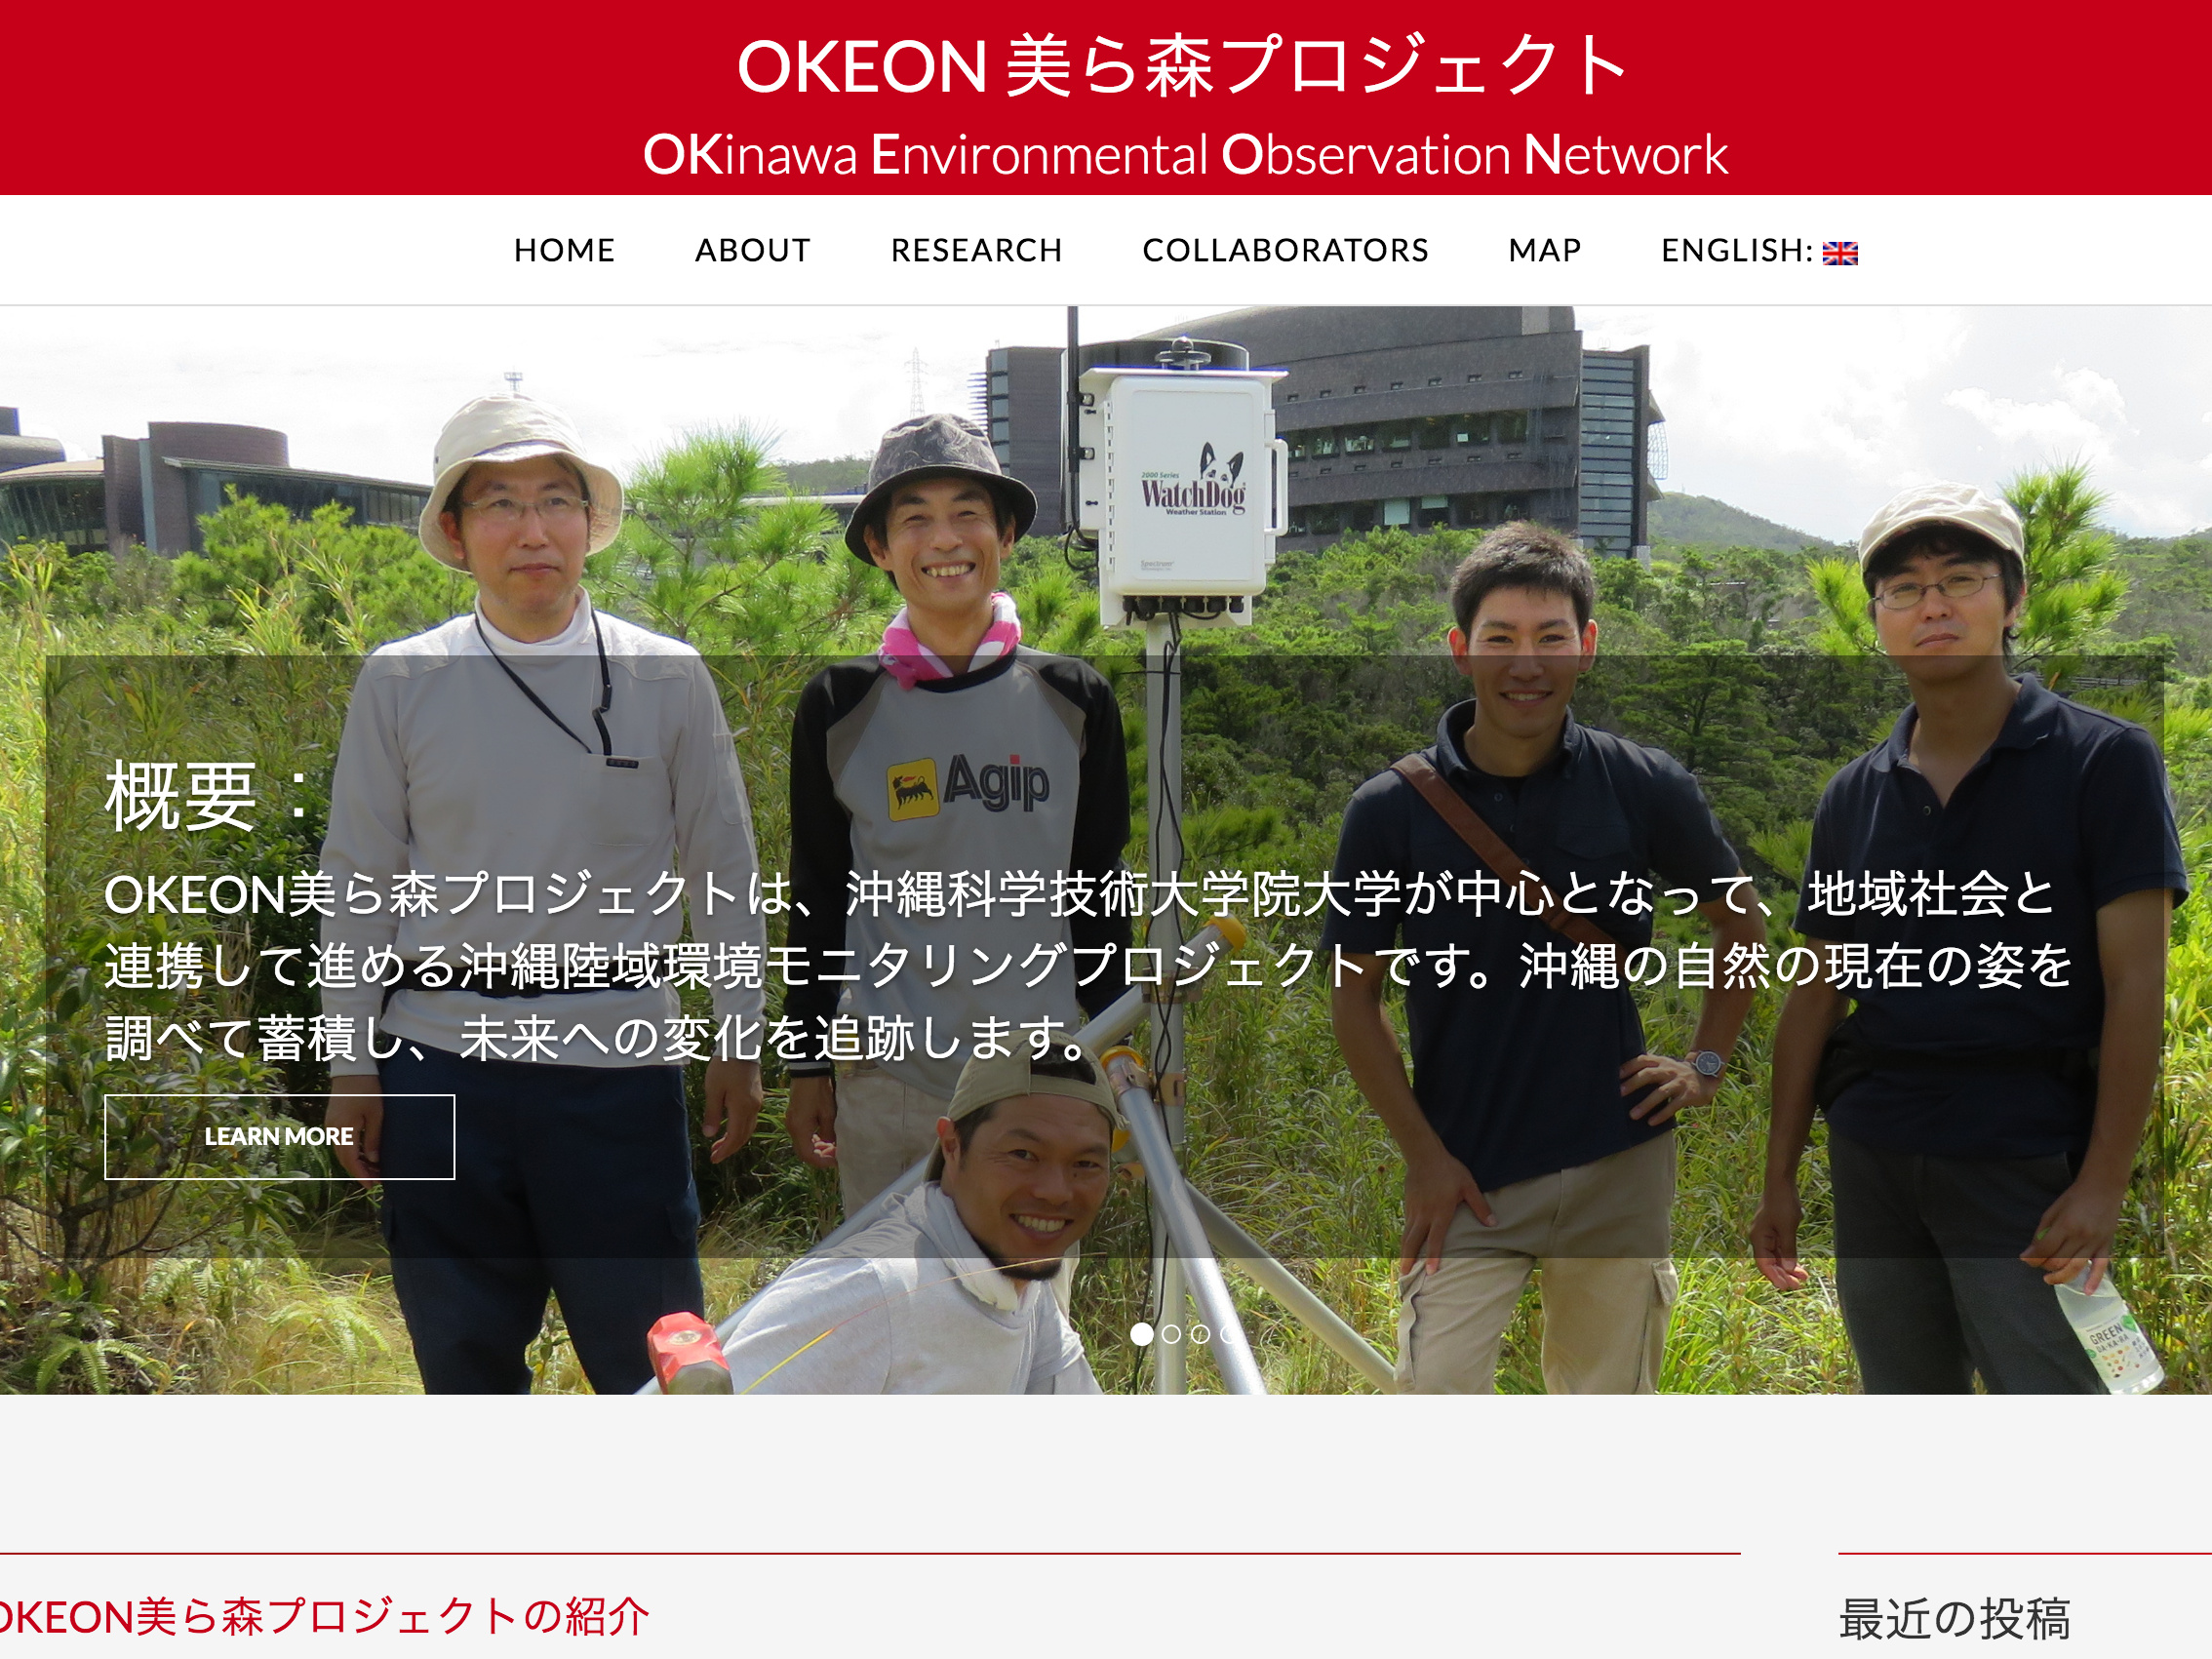
I worked at the Okinawa Institute of Science and Technology at a biodiversity / biocomplexity lab for four years, where I worked on science communication, created tools to help scientists (such as antmaps.org), and helped with scientific publications. I also created tools for other scientists at the institution: Here are a couple of maps on coral dispersal network as well as high sea connectivity I built for marine biologists.
I have a general interest in the startup scene as well as tech innovations. I worked with Startup Genome as a freelance data journalist to put together the Global Startup Ecosystem Report 2023 based on data-driven insights and conducted additional research to further support the various insights. On the VC front, I created a tool to explore data-driven insights for a VC to help them visualize their internal datasets.
International affairs & policy
I worked with UNESCO's Education Policy team for a year as a communication specialist, where I also got to work on topics related to the right to education and education in the context of climate displacement.
Later on, I worked as a consultant with UNDP, more specifically UN Volunteers, on a series of stories to communicate the importance of their work, specifically for a thematic meeting.
Finally, I also worked with UN-OCHA on a couple of different fronts. First as a data journalism fellow for the Centre for Humanitarian Data, where I fucsed on communicating the humanitarian consequences of climate change in the Sahel, where many countries are disproportionately vulnerable to the effects of climate change. Moreover, I worked as a consultant for OCHA to conduct quantitative data analysis and create visuals to further support the findings of a report on climate change.
Talks & workshops
ICRC Museum: Data
visualization workshop (2024 March, in Geneva)
UN-SIAP: Data journalism, process, and tools deep-dive (2022 March)
Outlier Conference: Two heads are better than one: a collaborative data viz journey
sparked by Outlier (2022 Feb)
Southern Navarene University Digital Humanities: Intro to data journalism (2021 Dec)
UN World Data Forum: Open-source tools for creating data viz & maps (2021 Oct)
Centre for Humanitarian Data: Data journalism fellowship showcase (2021 July)
CV
Julia's Timeline
-
2022 September - PRESENT
AFP: Data journalist
-

2023 March - PRESENT
Urban Institute: Dataviz Developer (freelance)
-

2023 February - 2023 May
Startup Genome: Data journalist (freelance)
-
2022 April - 2023 January
Stamen: Design Technologist (contract)
-
2021 September - 2022 March
UN-OCHA: Data Analysis & Visualization Consultant
-
2021 June - August
Centre for Humanitarian Data: Data Journalism Fellow
-

2020 July - 2022 August
Reuters: Data Journalist (Freelance)
-
2020 March - PRESENT
Climate Policy Initiative: Data Visualization Designer
-

2020 February - 2021 June
UNESCO: Communications Specialist
-

2020 January - 2021 June
Global Fishing Watch: Graphics Consultant
-
2020 January - July
United Nations Volunteers: Data Visualization Consultant
-

2018 June - 2019 August
UW Madison M.S. Environmental Observation and Informatics
-
2017 July - 2019 May
Environmental Investigation Agency: Data Visualization Consultant
-

2015 November - April 2017
Legal Atlas: GIS & Mapping Consultant (contract)
-

2015 January- 2018 May
OIST: Computing Technician. Okinawa, Japan.
-
May 2014
M.S. Entomology, UW-Madison
-
Sept 2011- May 2014
UW-Madison: Entomology Teaching Assistant
-
May 2010
B.S. Conservation Biology, Japanese. UW-Madison
-
September 2008 - July 2009
Japanese Language Program. Keio University, Tokyo, Japan
JLPT Level 1


 Go to site: